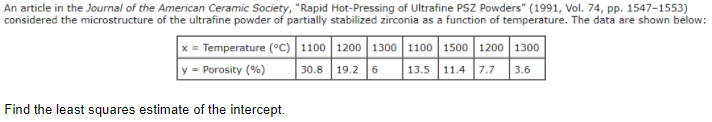
Find the least squares estimate of the Intercept = Find the least squares estimate of the slope =


Q: During a basketball game, Tatiana is shooting two free throws. Tatiana makes 91% of their free throw...
A:
Q: The table to the right gives the average sales tax rate (state plus local) in six east coast state...
A: Given data East coast states West coast states A 6.70% ...
Q: Dr. Mackintosh believes a new olfactory therapy would be more successful in promoting weight loss am...
A: Solution Independent variables are: 1. Factory Therapy 2. Dance Therapy 3. Control condition
Q: (a) What is the probability that more than two calls are received in a one-hour period? (b) What is ...
A: Here As per POLICY I HAVE CALCULATED 3 subpart only
Q: During a basketball game, Tatiana is shooting two free throws. Tatiana makes 91% of their free throw...
A: Given Tatiana makes 91% of their free throws.
Q: A small manufacturing company recently instituted Six Sigma training for its employees.
A: Solving (a): P(Online Training) The total employee is: The employees for online training is: So,...
Q: Dr. Mackintosh believes a new olfactory therapy would be more successful in promoting weight loss am...
A: We have to use definition of type 2 error.
Q: The Statistics Games are played by a large number of students across the county. Last year, 32% of C...
A:
Q: A computer programming team has 13 members. Suppose seven team members are women and six are men. Ho...
A:
Q: A pediatrician wants to determine the relation that may exist between a child's height and head circ...
A: Solution Given that Height Head Circumference 27 17.5 25 ...
Q: An artide in the Journal of Agricultural Engineering Research (Vol. 52, 1992, pp. 53-76) describes a...
A: A : 70o C B : 75o C C : 80o C
Q: In how many ways can you place 20 identical balls into five different boxes if each boxes has to con...
A: Here we have to find 20 identical balls into five different boxes so that each box contain at least ...
Q: a. Build a clearly labeled chart that illustrates the percent of the budget that goes into each majo...
A: The data as follows, Defence 608 Social Security 803 Medicare 495 Medicaid 265 Unemployme...
Q: Suppose x is a random variable best described by a uniform probability distribution with c= 20 and d...
A:
Q: When purchasing bulk orders of batteries, a toy manufacturer uses this acceptance sampling plan: Ran...
A:
Q: In a test of the effectiveness of garlic for lowering cholesterol, 47 subjects were treated with gar...
A:
Q: According to the Pew Research Center, 29% of Americans have not read a book in the past year. Let p ...
A:
Q: In 2018, migration rate in the US was 3.2 (per 1,000 population). Given that the population of the U...
A: Given data In 2018 migration rate in the U.S was 3.2 (per 1000 population) Given that population of ...
Q: Find the area under the normal curve of Z = -001 to Z = 0.01 Provide a graph
A:
Q: Renee scores an average of 153 points in a game of bowling and her points in a game of bowling are n...
A:
Q: An article in the Journal of Sound and Vibration (Vol. 151, 1991, pp. 383-394) described a study inv...
A: Use EXCEL to determine the regression equation. EXCEL procedure: Go to EXCEL Go to Data>Data...
Q: Steel rods are manufactured with a mean length of 25 centimeter (cm). Because of variability in the ...
A: Given data: Mean = 25 cm Standard deviation = 0.06 cm
Q: Please answer this correctly. Question: Which of these is an example of a categorical variable? a...
A: In statistics, according to measurement, data can be categorized in two types, such as quantitative ...
Q: Probability tree. Weighing produce problem. A supermarket has three employees who package and weigh ...
A: Solution: From the given information,
Q: Efficient manufacturing: Efficiency experts study the processes used to manufacture items in order t...
A:
Q: The amount of snowfall falling in a certain mountain range is normally distributed with an average o...
A: From the provided information, Mean (µ) = 170 inches Standard deviation (σ) = 20 inches X~N (170, 20...
Q: Consider a country where, to become president, a candidate must win 294 of the total of 578 votes in...
A:
Q: 5. Finding means, variances, medians. For the following probability density function, fx(x), of a ra...
A:
Q: The table gives a set of outcomes and their probabilities. Let A be the event "the outcome is divisi...
A:
Q: With standard deviations of s1 = 8.88 and s2 = 30.22, and sample sizes of n1 = 7 and n2 = 8, find th...
A:
Q: Consider the following model: Yijk= µ+ a;+ Bj+ Yk+ €ijk 1 < i < I, 1< j< J,1 <k< K, where eijk's are...
A: Latin Square Design Latin Square design the treatments are placed in a balanced fashion in a square ...
Q: 14 Jamison Headrick Hr 4 Share pulo M Replace OFind AaBbCcD AdB AaBbCcD AaBbCcD AaBbCcD AOBBCCD AaBb...
A: A data can be raw or grouped, with some pro and cons associated with both of them. The raw data has ...
Q: Find the indicated probability. 20. The lengths of human pregnancies are normally distributed with a...
A: Given,mean(μ)=268standard deviation(σ)=15
Q: The table to the right gives the average sales tax rate (state plus local) in six east coast state...
A: The mean of a dataset is the average value of observations. It can be calculated by dividing the sum...
Q: Use the box-and-whisker plot to identify the five-number summary. ww.... Min = 11 14 16 17 21 12 14 ...
A:
Q: A combination lock uses 3 numbers, each of which can be 0 to 38. If there are no restrictions on the...
A:
Q: A researcher examined the extent of cooperation among kindergarten children. She unobtrusively obser...
A:
Q: Range = (Round to one decimal place as needed.) Sample standard deviation = (Round to one decimal pl...
A: Range of a data set is the difference between the minimum and maximum observations.
Q: How likely is it hat she didn't interview a plumber on either day? Express your answer in 2 decimal...
A:
Q: Question 4 a) A medical researcher wants to investigate the amount of time it takes for patients' he...
A: Given data: a). Population standard deviation = 25 Margin of error = 5 minutes Confidence level = 9...
Q: Subject 2. 4 1 11 10 6. 8. 8. 8.56 Type 2 13 14 14 10 11 11 13 11 12 12.11 of Stool 3 11 12 13 10 9 ...
A: Given: Sub 1 Sub 2 Sub 3 Sub 4 Sub 5 Sub 6 Sub 7 Sub 8 Sub 9 Type 1 11 10 7 7 8 9 9 8 8 8.5...
Q: Find 96% confidence interval for the percentage of registered Democrats in the county. A sample of 1...
A:
Q: A laboratory investigator interested in the relationship between diet and the development of tumors ...
A:
Q: (e) Explain why you might want to potentially use the formula n > 4h? instead of n 2 2P (1 – p) when...
A: when there is no prior estimate of the sample proportion () is known, then we use, putting the valu...
Q: is a sampling considered biased?
A: We know that The sampling method is called biased when it favors some outcomes over the others avail...
Q: Find the following probability for the standard normal random variable z. e. P(z20) f. P(-2.54 sz 1....
A:
Q: Could the graph represent a normal curve? Select all that apply. O A. No, because the highest point ...
A: Here use normal curve probability for identifying correct statements
Q: Each year students in a local school district write a national examination. The average on this nati...
A:
Q: The table shows the changes in the water level of a pond over several weeks. Order the numbers from ...
A: The given table shows the changes in the water level of a pond over several weeks:
Q: A distribution of values is normal with a mean of 60.5 and a standard deviation of 22.3. Find the pr...
A: The provided information are: A distribution of values is normal mean=μ=60.5 standard deviation=σ=2...
Find the least squares estimate of the Intercept =
Find the least squares estimate of the slope =
Please help me with homework, please show solution, thanks


Trending now
This is a popular solution!

Step by step
Solved in 2 steps

- Use the table of values you made in part 4 of the example to find the limiting value of the average rate of change in velocity.The following fictitious table shows kryptonite price, in dollar per gram, t years after 2006. t= Years since 2006 0 1 2 3 4 5 6 7 8 9 10 K= Price 56 51 50 55 58 52 45 43 44 48 51 Make a quartic model of these data. Round the regression parameters to two decimal places.An article in the Journal of Applied Polymer Science (Vol. 56, pp. 471–476, 1995) studied the effect of the mole ratio of sebacic acid on the intrinsic viscosity of copolyesters.- The data follows: Viscosity 0.45 0.2 0.34 0.58 0.7 0.57 0.55 0.44 Mole ratio 1 0.9 0.8 0.7 0.6 0.5 0.4 0.3 (a) Construct a scatter diagram of the data.
- A number of studies have shown lichens (certain plants composed of an alga and a fungus) to be excellent bioindicators of air pollution. The article “The Epiphytic Lichen Hypogymnia physodes as a Biomonitor of Atmospheric Nitrogen and Sulphur Deposition in Norway” (Environ. Monitoring Assessment, 1993: 27–47) gives the following data (read from a graph) on x ¼ NO3 wet deposition (g N/m2 ) and y ¼ lichen N (% dry weight): (refer to chart) The author used simple linear regression to analyze the data. Use the accompanying MINITAB output to answer the following questions: a. What are the least squares estimates of b0 and b1? b. Predict lichen N for an NO3 deposition value of .5. c. What is the estimate of s? d. What is the value of total variation, and how much of it can be explained by the model relationship?The following partial JMP regression output for the Fresh detergent data relates to predicting demand for future sales periods in which the price difference will be .10. SE Fit = .165360573, s = .628152. Predicted Demand Lower 95% MeanDemand Upper 95% MeanDemand 31 8.181072245 7.842346262 8.519798229 StdErr IndivDemand Lower 95% IndivDemand Upper 95% MeanDemand 0.649552965 6.850522511 9.511621980 Click here for the Excel Data File (a) Report a point estimate of and a 95 percent confidence interval for the mean demand for Fresh in all sales periods when the price difference is .10. (Round your CI answers to 3 decimal places and other answer to 4 decimal places.) (b) Report a point prediction of and a 95 percent prediction interval for the actual demand for Fresh in an individual sales period when the price difference is .10. (Round your PI answers to 3 decimal places and other answer to 4 decimal places.) (c) StdErr Indiv Demand on…Snowpacks contain a wide spectrum of pollutants thatmay represent environmental hazards. The article“Atmospheric PAH Deposition: Deposition Velocitiesand Washout Ratios” (J. of EnvironmentalEngineering, 2002: 186–195) focused on the depositionof polyaromatic hydrocarbons. The authors proposeda multiple regression model for relating depositionover a specified time period (y, in mg/m2) to tworather complicated predictors x1 (mg-sec/m3) and x2 (mg/m2), defined in terms of PAH air concentrations forvarious species, total time, and total amount of precipitation.Here is data on the species fluoranthene andcorresponding Minitab output:obs x1 x2 flth1 92017 .0026900 278.782 51830 .0030000 124.533 17236 .0000196 22.654 15776 .0000360 28.685 33462 .0004960 32.666 243500 .0038900 604.707 67793 .0011200 27.698 23471 .0006400 14.189 13948 .0004850 20.6410 8824 .0003660 20.6011 7699 .0002290 16.6112 15791 .0014100 15.0813 10239 .0004100 18.0514 43835 .0000960 99.7115 49793 .0000896 58.9716 40656…
- A researcher hypothesizes that in a certain country the net annual growth of private sector purchases of government bonds, B, is positively related to the nominal rate of interest on the bonds, NI, and negatively related to the rate of inflation Π: Bt = a0 + a1NIt + a2Π t + ut Note that it may be hypothesized that B depends on the real rate of interest on bonds, R, where R = NI – Π. Using a sample of 56 annual observations, s/he estimates the following equations: (1) Bt = 0.43 + 0.90NIt - 0.97Πt R21 = 0.962, SSR1 = 2.20, QRESET(F1,52) = 16.6 (3.58) (8.80) (-1.05) (2) Bt = 0.44 + 0.94Rt R22 = 0.960, SSR2 = 2.22, QRESET(F1,53) = 0.9 (9.70) (16.7) (3) Bt = 0.44 + 1.14NIt SSR3 = 9.20, QRESET(F1,53) = 59.9 (8.84) (36.1) (4) NIt = 0.08 + 0.94Πt R24 = 0.997, SSR4 = 0.18, QRESET(F1,53) = 1.4…The table below shows (lifetime) peptic ulcer rates (per 100 population), UU, for various family incomes, xx, as reported by the 1989 National Health Interview Survey. Income 4000 6000 8000 12000 16000 20000 30000 45000 60000 Ulcer rate 14.1 13.1 13.8 12.6 11.8 11.7 11.5 9.3 7.6 (a) Find the equation of the regression line. Ulcer rate, U(x)= . (b) Estimate the peptic ulcer rate for an income level of x0= 25000 according to the linear model in part (a). Ulcer rate, U(x0)= .The accompanying dataset provides data on the monthly usage of natural gas (in millions of cubic feet) for a certain region over two years. Implement the Holt-Winters multiplicative seasonality model with no trend to find the forecast for periods 13-26, where alphaαequals=0.50.5 and gammaγequals=0.80.8. Then find the MAD for periods 13-24. Month Period Gas Usage Jan 1 242 Feb 2 227 Mar 3 153 Apr 4 144 May 5 55 Jun 6 34 Jul 7 29 Aug 8 27 Sep 9 28 Oct 10 40 Nov 11 88 Dec 12 203 Jan 13 231 Feb 14 248 Mar 15 251 Apr 16 139 May 17 35 Jun 18 32 Jul 19 28 Aug 20 26 Sep 21 27 Oct 22 38 Nov 23 86 Dec 24 182 Use the Holt-Winters multiplicative seasonality model with no trend to find the forecast for periods 13-18, periods 19-24, and then for periods 25 and 26. (Type integers or decimals rounded to two decimal places as needed.) Period Forecast 13 14 15 16 17 18
- The Lorenz curves for the income distribution in the United States for all races for 2015 and for 1980 are given below. 2015: y = x2.661 1980: y = x2.241 Find the Gini coefficient of income for both years. (Round your answers to three decimal places.) 2015: 1980:Below you are given a partial Excel output based on a sample of 16 observations. ANOVA df SS MS F Regression 4,853 2,426.5 Residual 485.3 Coefficients Standard Error Intercept 12.924 4.425 x1 -3.682 2.630 x2 45.216 12.560 The interpretation of the coefficient of x1 is that _____. a. a one-unit increase in x1 will lead to a 3.682-unit decrease in y when all other variables are held constant b. a on-unit increase in x1 will lead to a 3.682-unit decrease in x2 when all other variables are held constant c. It is impossible to interpret the coefficient. d. a one-unit change in x1 will lead to a 3.682-unit decrease in yConsider a linear regression model for the decrease in blood pressure (mmHg) over a four-week period with muy=2.8+0.8x and standard deviation chi=3.2. The explanatory variable x is the number of servings fruits and vegetables in a calorie-controlled diet. Using the 68-95-99.7 rule, between what two values would approximately 95% of the observed responses, y, fall when x = 7?
