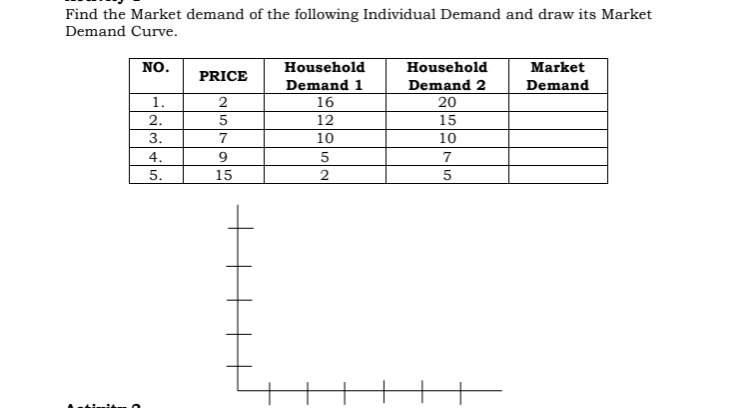
Find the Market demand of the following Individual Demand and draw its Market Demand Curve. Household Demand 2 20 NO. Household Market PRICE Demand 1 16 12 10 Demand 1. 2. 3. 15 7 10 4. 7 5. 15


Q: 1. Solve for the demand and supply function/equation. Show your solution. Price Quantity Demanded…
A: Answer is given below
Q: Figure 4-10 Price| S1 S2 M K D2 D1 Quantity Refer to Figure 4-10. The shift from S2 to S1 in the…
A: Meaning of Demand and Supply: The term demand refers to the willingness of an individual to…
Q: 4. Movements along versus shifts of demand curves Consider the market demand for cereal. Complete…
A: There is a movement along the demand curve when there is a change in quantity demanded due to change…
Q: Suraya loves chocolate truffles. As the price of a chocolate truffle increases from $1 to $2 to $3,…
A: Given that Suraya continues to buy a dozen chocolate truffles every week even if the price of…
Q: Identify two causes, apart from an increase in income, of an increase in demand for a product.
A: Demand for a product implies the desire of people to have a good supported by the willingness and…
Q: P3 E P2 P1 - D 1. A C Q Q2 Q3 Q4 Qs Qe Qr Refer to Figure 4.2. The demand curve E is most likely to…
A: The demand curve 'E' is a horizontal curve so the demand curve is perfectly elastic and it is a…
Q: When the price of photocopiers increases by 13%, the associated change in printers demanded is 6%.…
A: Cross-price elasticity of demand, this measurement is calculated by taking the percentage change in…
Q: List and explain three non-price determinants of demand. Explain how a change in each of them can…
A: The non-price determinants of demand are an important factor which changes the demand of goods…
Q: An increase in the price of electricity will: a) increase the demand for kerosene heaters. b)…
A: Demand is defined as an economic term that refers to a customer's ability to purchase goods and…
Q: Explain, with the aid of a graph, the impact on the equilibrium price and equilibrium quantity in…
A: The Equilibrium is attained where Demand = Supply. The change in Price causes change in demand…
Q: Exercise 1: Shifts in the Demand Curve. In recent years, sales of music CDs have decreased as many…
A: Demand refers the total amount of goods and services that are willing and able to buy at the…
Q: Q4. Law of demand shows relation between: Income and price of commodity Price and quantity of a…
A: Meaning of Demand and Supply: The term demand refers to the willingness of an individual to…
Q: In the market for beef, the price of a pound of beef rises. Explain the effect of this event on the…
A: Supply curve shows a positive relationship between price and quantity supplied. There are various…
Q: ASSUME THAT A DECREASE OF 10% AND THE PRICE OF CARS RESULT IN AN INCREASE OF 40% IN QUANTITY…
A:
Q: Consider the market for beef, if there is an increase in the price of chicken and an increase in the…
A: Chicken and beef are substitute goods. Increase in price of chicken would shift the demand curve of…
Q: Which of the following is a determinant of demand? A) the price of a substitute goods B) the price…
A: In a market, there are various determinants of demand that have the ability to influence the…
Q: True/False With a fall in the income demand for the normal goods will rise
A: According to the given questions the normal goods are those goods the demand of which considerably…
Q: Kamika lives in Chicago but goes to school in Tucson, Arizona. For the last 2 years, she has made…
A: The economics as a study is based upon the idea that the societies, and the economies tend to have a…
Q: 1. A substitute product is defined as a product that can be used for a similar purpose as the other…
A: Two goods are substitutes when only one of them is enough to satisfy the need.
Q: Please Analyze and explain the theory of Demand and Supply (Chapter 2) and create the graph for…
A: In the free market, equilibrium price and quantity are determined by the intersection of demand and…
Q: Consider the market for minivans. If the price of steel decreases, then the quantity of minivans…
A: (a). Increase. Steel is the input used in the production of the body for the car. If the price of…
Q: DRAW THE DEMAND CURVE AND LIST FOUR THINGS TO SHIFT THE CURVE TO THE LEFT-
A: Four things that shift demand curve 1)Taste of consumers If taste of consumers for certain product…
Q: Draw the graphs and explain the factors that cause the movement along the demand curve and shifts of…
A: Demand curve shows the relationship between the price and the quantity demanded. It’s a downward…
Q: Make a graph to illustrate the effects of the following events on the demand curve and explain:…
A: Demand curve indicates the relationship between quantity of demand and price. It shows the total…
Q: Explain the difference between a shift in the Demand Curve and movement along the demand curve. Give…
A: The measure that depicts the quantity of a service or product which a consumer is willing to buy at…
Q: Income of a person is Rs.8000 and he uses 60 units of a commodity. Calculate income elasticity of…
A: Income elasticity of demand measures the sensitivity of quantity demanded of a good or a service to…
Q: .Make a graph to illustrate the effects of the following events on the demand curve and explain: a.…
A: a. As the major oil companies roll back gasoline prices, there will be movement along the demand…
Q: Income of a person is Rs.8000 and he uses 60 units of a commodity. Calculate income elasticity…
A: The income of a person is Rs.8000 He uses 60 units of a commodity The income increased by 30%…
Q: In the market for jeans, which of the following events increases the demand for a pair of jeans? А.…
A: "Since you have asked multiple questions, we will solve first question for you .. If you want any…
Q: Suppose there is a product whose price is increasing but it has no impact on quantity demand…
A: If an increase in price does not change quantity demanded, it means the demand curve is vertical at…
Q: State and explain with suitable diagrams of the law of demand. What are the reasons for the downward…
A: The Law of demand explains the inverse or negative relationship between quantity demand for a good…
Q: EP Qp and Qs are quantity demanded and supplied of perfume, res t is the equilibrium price and…
A: Whenever the worth of elasticity is more prominent than 1.0, it proposes that the demand for a long…
Q: 3. Movements along versus shifts of demand curves Consider the market demand for cereal. Complete…
A: Demand refers to the total quantity of a good which an individual is able and willing to buy at the…
Q: In the market for smartphones, what event decreases the demand for smartphones today? The demand…
A: Demand for a good is affected when other factors like consumer tastes, price of related goods, and…
Q: Income of a person is Rs.8000 and he uses 60 units of a commodity.Calculate income elasticity of…
A: ‘Income elasticity of demand’ refers to the percentage(%) change in quantity(Q) demanded in relation…
Q: Income of a person is Rs.8000 and he uses 60 units of a commodity. Calculate income elasticity of…
A: The income elasticity of demand measures the responsiveness of percentage change in demand due to…
Q: Demand Schedule and Curve for Music CDs Place the following prices and quantities for CDs in the…
A: The law of demand states that the price of the good and the quantity of the good are inversely…
Q: lain the horizontal and vertical interpretation of the demand cur
A: The demand curve is the graphical representation of the inverse relationship between the price and…
Q: Identify and explain three (3) factors that affect the demand curve
A: According to the law of demand, there is an inverse relationship between the price of a good and the…
Q: The price of cakes falls from $4 to $3 and the quantity purchased increases 80%, then demand for…
A: P0 = 4 P1 = 3 % change in Quantity = 80% % Change in Price = 28.5%


Trending now
This is a popular solution!

Step by step
Solved in 3 steps with 3 images

- Because Income depends on work effort and work effort depends on nutrition, suppose the relationship between income (Y) and total food availability (F) in a poor household is given by: Y = 10F + 20F2 – 0.6F3 a) If food availability in a two-person household is 20, would it be “rational” to share the food? Explain. b) If food availability in a two-person household is 30, would it be “rational” to share the food? Explain.If the social welfare function produces concave social welfare indifference curves, social welfare can be increased by reallocating income between households if their marginal utilities of income differ. TRUE OR FALSEThe most general form of a social welfare function (SWF ) can be written as W = W(U1; ... ; UH). a. Explain the following properties that a SWF may satisfy: non paternalism, Pareto principle, anonymity (the names of the agents do not matter), and concavity (aversion to inequality). b. Consider two agents h = 1; 2 with utilities U1 and U2. Depict the social indifference curve of the utilitarian SWF in (U1; U2)-space. Which of the properties in part a does it satisfy? c. Depict the social indifference curves of the maxim in or Rawlins SWF. Contrast to the utilitarian SWF with respect to the aversion to inequality. Which properties does the Rawlins SWF satisfy? d. The Bernoulli-Nash social welfare function is given by the product of individual utilities. Discuss the distributional properties of the Bernoulli-Nash SWF.
- e(p, u) = up1αp2βp3γ Find the indirect utility function Find the Walrasian demand function Verify Roy's identity Recover consumer's direct utility functionWhat relationship exists between income and well-being in the well-being curve found in the figure? Satisfaction (0-10 scale) 7.45 7.40 Average responses from surveys asking where you stand between the best possible life for you (which is 10/10) and the worst (0/10). 6.5 5.7 Small fall in well-being of rich Large rise in well-being C of poor B To the poor $0 $20,000 $45,000 Well-being curve From the rich B $175,000 $200,000 Annual income a negative relationship with increasing marginal gains in well-being as income rises a negative relationship with decreasing marginal gains in well-being as income rises a positive relationship with increasing marginal gains in well-being as income rises Note:- Do not provide handwritten solution. Maintain accuracy and quality in your answer. Take care of plagiarism.Answer completely.You will get up vote for sure.Explain the concept of the utility possibility frontier. What is the role of the utilitypossibility frontier in the social welfare maximization problem of a welfarist society?
- Assume coffee and tea are substitutes. Assume income is $100, Pcoffee = $2 and Ptea = $4. Then the relative price of an additional cup of coffee is ______ cup(s) of tea, and the relative price of an additional cup of tea is ______ cup(s) of coffee . 2,.05 2,1 1,2 .5,2President Vladimir Putin of Russia proposed replacing in-kind subsidies such as free public transportation and rent-free apartments for government workers with cash subsidies of between $20 and $120 per month. The proposal led to widespread complaints among Russian citizens that the cash subsidies were not large enough. One reportedly asked, “What is a perk worth?” Use an indifference curve analysis to show how to convert an in-kind subsidy into a cash subsidy that leaves people equally well off.Clancy is an accountant who enjoys donuts and muffins. Suppose that the price of donuts increases. As a result, the purchasing power of Clancy's paycheck is diminished. Therefore, he reduces his consumption of all goods, including donuts. This phenomenon is known as the (substitution/income) effect.  Show Transcribed Text  Show Transcribed Text shift of/movement along at every price /due to a change in price
- Explain why the Second Fundamental Theorem of Welfare Economics implies that there is no intrinsic trade-off between efficiency and interpersonal equity.4. Show how to construct the reference dependent utility function for two friends Kate and Mary whose gains and losses are listed as follows : Kate's net worth is $ 4.5 million ( decreased from $ 5.5 to $ 4.5 million ) Mary's net worth $ 3.2 million ( increased from $ 3 to $ 3.2 million ) ( First determine the reference point ( use a parameter ) and then derive reference utility function for each ) .Allocating Income to Maximize utility is essential in microeconomic theory, based on the following figures, where P of A = 3 OMR and P of B = 6 OMR Q TU of A TU of B MU of A MU of B MUA/P MUB/P 1 12 21 2 22 33 3 28 42 4 32 48 5 34 51 6 34 51 The Required: Fill the table above Explain when the Utility maximization holds
