Find the mean of the test results of 100 students in Engineering Data Analysis using the midpoint and deviation method. Table: Test Results of 100 Students in Engineering Data Analysis class Interval Frequency 15-24 5 25-34 10 35-44 11 45-54 23 55-64 26 65-74 14 75-84 8. 85-94 3
Find the mean of the test results of 100 students in Engineering Data Analysis using the midpoint and deviation method. Table: Test Results of 100 Students in Engineering Data Analysis class Interval Frequency 15-24 5 25-34 10 35-44 11 45-54 23 55-64 26 65-74 14 75-84 8. 85-94 3

Glencoe Algebra 1, Student Edition, 9780079039897, 0079039898, 2018
18th Edition
ISBN:9780079039897
Author:Carter
Publisher:Carter
Chapter10: Statistics
Section10.5: Comparing Sets Of Data
Problem 14PPS

Related questions
Question
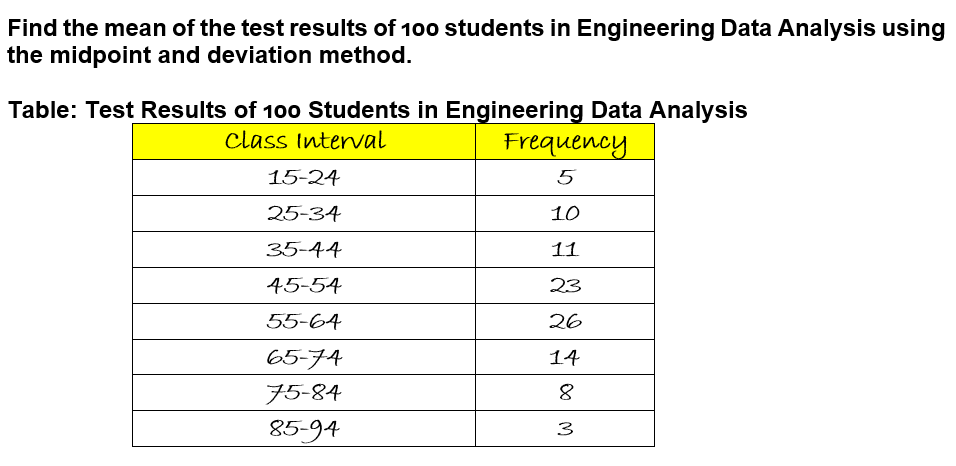
Transcribed Image Text:Find the mean of the test results of 100 students in Engineering Data Analysis using
the midpoint and deviation method.
Table: Test Results of 100 Students in Engineering Data Analysis
class Interval
Frequency
15-24
5
25-34
10
35-44
11
45-54
23
55-64
26
65-74
14
75-84
85-94
3
Expert Solution
This question has been solved!
Explore an expertly crafted, step-by-step solution for a thorough understanding of key concepts.

Step by step
Solved in 3 steps

Recommended textbooks for you
Glencoe Algebra 1, Student Edition, 9780079039897…
Algebra
ISBN:
9780079039897
Author:
Carter
Publisher:
McGraw Hill
Glencoe Algebra 1, Student Edition, 9780079039897…
Algebra
ISBN:
9780079039897
Author:
Carter
Publisher:
McGraw Hill