Find the mean salary for a small company which pays annu own in the following frequency distribution. Salary No. of Employees olution: | P11,000 P12,500 | P13,200 6. P18,5 10 8
Find the mean salary for a small company which pays annu own in the following frequency distribution. Salary No. of Employees olution: | P11,000 P12,500 | P13,200 6. P18,5 10 8

Glencoe Algebra 1, Student Edition, 9780079039897, 0079039898, 2018
18th Edition
ISBN:9780079039897
Author:Carter
Publisher:Carter
Chapter10: Statistics
Section10.5: Comparing Sets Of Data
Problem 14PPS

Related questions
Question
Find the weighted
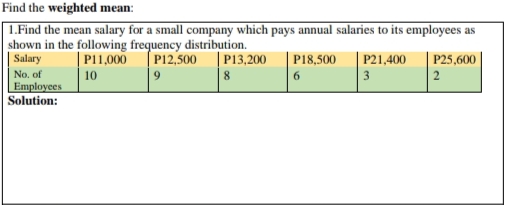
Transcribed Image Text:Find the weighted mean:
| 1.Find the mean salary for a small company which pays annual salaries to its employees as
shown in the following frequency distribution.
| Salary
| P11,000
P12,500
| P13,200
P18,500
P21,400
|3
P25,600
No. of
Employees
Solution:
10
8
6.
2
Expert Solution
This question has been solved!
Explore an expertly crafted, step-by-step solution for a thorough understanding of key concepts.

This is a popular solution!

Trending now
This is a popular solution!

Step by step
Solved in 2 steps with 2 images

Recommended textbooks for you
Glencoe Algebra 1, Student Edition, 9780079039897…
Algebra
ISBN:
9780079039897
Author:
Carter
Publisher:
McGraw Hill
Glencoe Algebra 1, Student Edition, 9780079039897…
Algebra
ISBN:
9780079039897
Author:
Carter
Publisher:
McGraw Hill