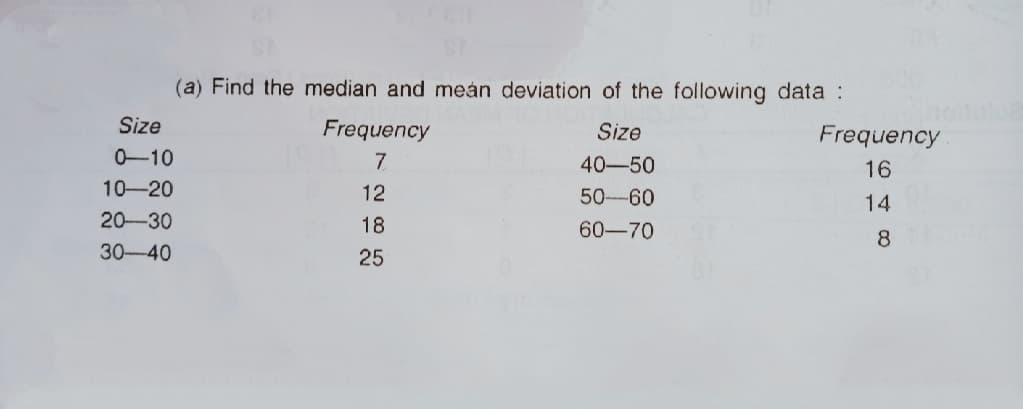
(a) Find the median and meán deviation of the following data : nol Frequency Size Frequency Size 0-10 7 40-50 16 10-20 12 50-60 14 20-30 18 60-70 8 30-40 25


Q: 4. Calculate the mean deviation (from median) from the following data and also calculate its co-…
A:
Q: 1. Given the data: 29.65 28.55 28.65 30.15 29.35 29.75 29.25 30.65 28.15 29.85 29.05 30.25 30.85…
A: “Since you have posted a question with multiple sub-parts, we will solve first three subparts for…
Q: 4. Find mean value of the given data. Scores Frequency (f) 41-45 36-40 8 31-35 26-30 14 21-25 16-20
A: Score and frequency are the given information, We have to form a table , Score Frequency (fi)…
Q: Determine the Mean, Range, Mean Deviation, Sample Variance, Sample Standard Deviation and…
A: Given: Class Interval f 39-42 2 35-38 15 31-34 11 27-30 9 23-26 5 19-22 3
Q: /For the below frequency distribution table calculate all the below reequipments. Class Frequency…
A: Since you have posted a question with multiple sub-parts, we will solve first three subparts for…
Q: 1. Analyze the sample data 16.35 18.85 16.20 17.75 19.58 17.73 22.75 23.78 23.25 19.08 19.62 19.20…
A: Given: Data 16.35 18.85 16.2 17.75 19.58 17.73 22.75 23.78 23.25 19.08…
Q: Example 11. Calculate the Standard Deviation from the following data Size of item frequency Size of…
A:
Q: Find mean, median and mode of the following grouped data:…
A:
Q: Q2 : A: Find the standard deviation and variance of the following data classes 10- 13- 16- 19-22…
A: Given data is Classes 10- 13- 16- 19-22 frequency 4 12 20 14 Class width = Upper class limit…
Q: 1. The following table shows the high temperatures over the last few days. Find the mean, median,…
A:
Q: - 6-6. Calculate mean deviation from median of the following distribution. Class Interval 50 100 100…
A:
Q: Example 13. Calculate the mean deviation from the mean for the following data: Class Interval: 0 - 4…
A: Class Frequency 0 - 4 4 4 - 8 6 8 - 12 8 12 - 16 5 16 - 20 2
Q: Consider the following frequency distribution for a sample of 20 observations Class 0 < 5 5 < 10 10…
A: Given Data: Class Midpoint (x) Frequency (f) (x-mean)2 f (x-mean)2 0-5 2.5 5 36 180 5-10 7.5…
Q: Calculate the quartile deviation and its Coefficient from the following data. Class-Interval…
A:
Q: The following scores represent the final examination grade for an elementary statistics course:- 23…
A: Hi! Thank you for the question, As per the honor code, we are allowed to answer three sub-parts at a…
Q: Here is a FDT for a small data set: data freq 12 1 13 3. 14 3. 15 16 9. Find the following measures…
A:
Q: A: Find the standard deviation and variance of the following data classes 10- 13- 16- 19-22 freq B:…
A:
Q: Which of the following levels of variability (standard deviation or variance) would most likely…
A: The platykurtic curve has shorter peak and thinner tail compared to normal distribution. The excess…
Q: Consider the following frequency distribution for a sample of 20 observations Class 0 <5 5< 10 10 <…
A: The table helps to find the sample variance. Interval Frequency Mid-point ∑f(x-x-bar)^2 0<5…
Q: QUESTION 1 A manufacturer claims that the average capacity for a certain type of battery is 140…
A: Given data is,138.8 , 139.1 , 141.1 , 139.7 , 137.4 , 140.9 , 138.2,139.2 , 136.7 , 141.8sample…
Q: Consider the following data set: 0, 2, 2, 3, 5, 6, 3 (a) µ = (b) Variance = (c) σ = (Round…
A: Given data 0,2,2,3,5,6,3 n=7
Q: Table 1.1 Mean Scores and Standard Deviations of the Study Variables Variables Means Std. Dev.…
A: The mean is calculated by adding all the observations divided by the total number of samples, it is…
Q: 4. Consider the following frequency distribution below: Classes 11-21 22-32 19 33-43 31 44-54 39…
A:
Q: a
A: “Since you have asked multiple questions, we will solve the first question for you. If you want any…
Q: Find the range, sample standard deviation and sample variance for the following data set: 19 20…
A:
Q: ****For the following data Size range (um) Frequency 20-39 2 40-59 32 60-79 64 80-99 48 100-119 30…
A: Given: Frequency distribution for Size range.The first column contains the intervals for size ranges…
Q: 1. The hourly rate of 100 college faculty members at Merriam College, Quezon City are distributed…
A: A measure of central tendency represents the central value or typical value of a set of…
Q: What is the population standard deviation of the data set? 2mg 11 mg 5 mg 12 mg 9 mg 9 mg 8…
A: Given, Data 2 11 5 12 9 9 8 4 3 11 8 11
Q: Question 2 One give you the distribution of all the shop turnovers of a large company in k€…
A: Formula Used: Mean = ∑FX∑F Wwhere F is the frequency and X is the mid-value Sample standard…
Q: Consider the following data: 62 61 83 92 67 89 83 50 80 69 95 50 73 71 73 88 66 89 73 51 58 86 73…
A: 1) Hi! Thank you for the question, As per the honor code, we are allowed to answer three sub-parts…
Q: Q) Consider the following ungrouped data: 18 11 22 19 24 24 23 10 11 16 21 23 18 27 25 30 21 16 12…
A: Arithmetic Mean: For a set of n observations, x1, x2, ... , xn arithmetic mean is given by,…
Q: The distribution of weekly production (tons) of a rice mill was as follows: Class 71-80 81-90…
A: The distribution of weekly production(tons) of a rice mill was as follows using continuous class:…
Q: Compute standard deviation and its coefficient from the following data: - -10 10-15 15-20 20-30 30-…
A:
Q: Q) Consider the following ungrouped data: 41 46 7 46 32 5 14 28 48 49 8 49 48 25 41 8 22 46 40 48…
A: Arithmetic mean : Arithmetic mean is the sum of all observations divided by total number of…
Q: An investor recorded the following annual returns of one of his investments. You are required to…
A: Given Year 2016 2017 2018 2019 2020 Return 15% 17% 19% 10% -5%
Q: 4. Find mean value of the given data. Scores Frequency (f) 41-45 1 36-40 31-35 26-30 14 21-25 16-20
A: The table helps to find the mean value. Scores Frequency mid point fx 41-45 1 43 43 36-40 8…
Q: 2. Question: The lifespan of wafer processing machines used by a semiconductor manufacturing company…
A:
Q: Determine the following: ● Mean ● Median Mode • Standard deviation Variance ● Class interval 30-34…
A: Given data is Class Interval Frequency 30 - 34 3 35 - 39 6 40 - 44 7 45 - 49 12 50 - 54…
Q: / Example 11. Find the mean deviation from (i) mean and (ii) median for the following daia: Marks :…
A:
Q: 28. (a) Find the median and meán deviation of the following data : Size Frequency Size Frequency…
A:
Q: 2) in a spot speed study for a highway section, the data were collected and shown in the table…
A: As per guidelines we will only answer first three subparts, please repost other subparts for more…
Q: Calculate the mean deviation (from median) from the following data : Class interval Frequency Class…
A:
Q: Q) Consider the following ungrouped data: 41 46 7 46 32 5 14 28 48 49…
A: The minimum value in the data is 5 and the maximum value of the data is 49. So the range of the data…
Q: 1. Find the measures of central tendency of frequency and standard deviation of the distribution…
A: Calculate Mean, Median, Mode, Population Standard deviation (σ), Sample Standard deviation (S) from…
Q: Q) Consider the following ungrouped data: 18 11 22 19 24 24 23 10 11 16…
A: Mean is the average value around which the whole data set is concentrated. Mean for the set of 'n'…
Q: Consider the following frequency distribution for a sample of 20 observations Class 0<5 5 < 10 10 <…
A:
Q: Question 3 The number of hours worked per week for a sample of ten students is shown below. Student…
A: 1. Mean: Mean is the expected value of a set of observations. In other words, mean is he average of…
Q: Calculate Mean, Median, Mode, Standard Deviation, Variance for the data below; 50, 43, 45, 41, 51
A:
Q: Consider the following data: 62 61 83 92 67 89 83 50 80 69 95 50 73 71 73 88 66 89 73 51 58 86 73…
A: Given data is appropriate for measures of central tendency and measures of dispersion. Measures of…
Q: Question 3 Calculate the mean deviation from mean and its coefficients from the following data: Size…
A:

Step by step
Solved in 2 steps with 2 images
