Find the mode(s) for the data items in the given frequency distribution. Score, x Frequency, f 1. 2 3 4 5 7 8 1 2 4. 5. ... Select the correct choice below and, if necessary, fill in the answer box within your choice. O A. The mode(s) is/are (Use a comma to separate answers as needed.) O B. There is no mode.
Find the mode(s) for the data items in the given frequency distribution. Score, x Frequency, f 1. 2 3 4 5 7 8 1 2 4. 5. ... Select the correct choice below and, if necessary, fill in the answer box within your choice. O A. The mode(s) is/are (Use a comma to separate answers as needed.) O B. There is no mode.

Glencoe Algebra 1, Student Edition, 9780079039897, 0079039898, 2018
18th Edition
ISBN:9780079039897
Author:Carter
Publisher:Carter
Chapter10: Statistics
Section10.6: Summarizing Categorical Data
Problem 7CYU

Related questions
Question
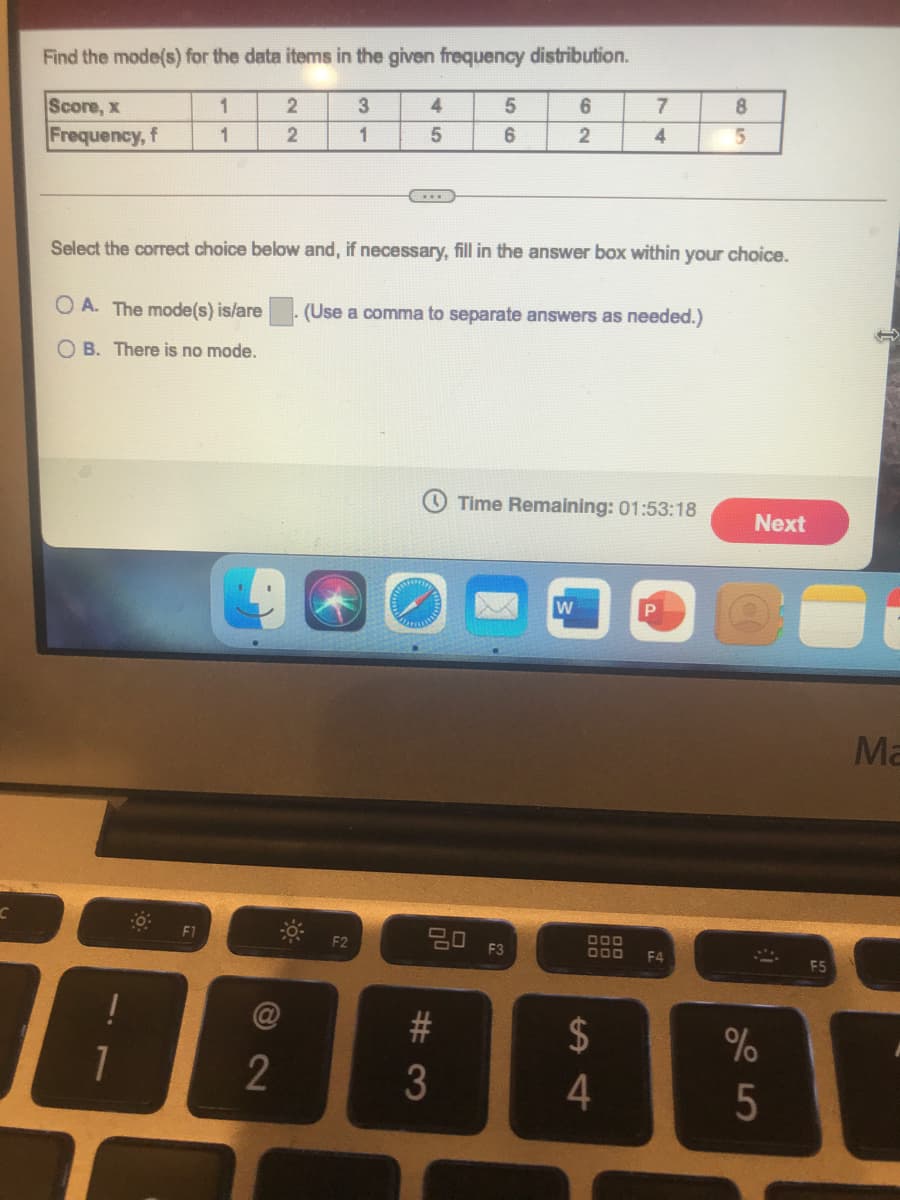
Transcribed Image Text:Find the mode(s) for the data items in the given frequency distribution.
Score, x
2
4
1
4
Frequency, f
Select the correct choice below and, if necessary, fill in the answer box within your choice.
A. The mode(s) is/are. (Use a comma to separate answers as needed.)
O B. There is no mode.
Time Remaining: 01:53:18
Next
w
Ma
F1
000
O00 F4
F2
F3
F5
$
4
5
# 3
Expert Solution
This question has been solved!
Explore an expertly crafted, step-by-step solution for a thorough understanding of key concepts.

This is a popular solution!

Trending now
This is a popular solution!

Step by step
Solved in 2 steps

Recommended textbooks for you
Glencoe Algebra 1, Student Edition, 9780079039897…
Algebra
ISBN:
9780079039897
Author:
Carter
Publisher:
McGraw Hill

Algebra & Trigonometry with Analytic Geometry
Algebra
ISBN:
9781133382119
Author:
Swokowski
Publisher:
Cengage
Glencoe Algebra 1, Student Edition, 9780079039897…
Algebra
ISBN:
9780079039897
Author:
Carter
Publisher:
McGraw Hill
Algebra & Trigonometry with Analytic Geometry
Algebra
ISBN:
9781133382119
Author:
Swokowski
Publisher:
Cengage