Residual Plot 20 24 20 40 100 10 15 20 Order (Time) 
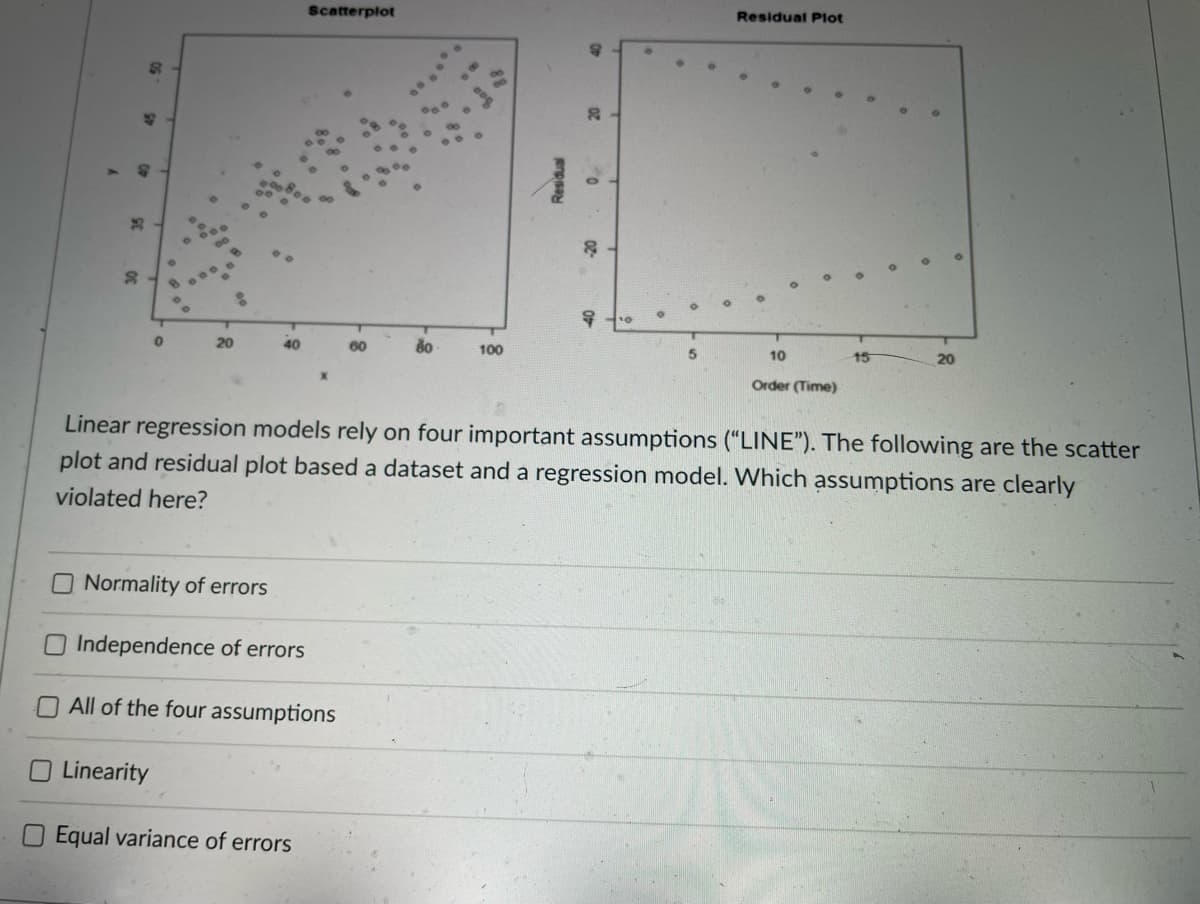
Linear regression models rely on four important assumptions ("LINE"). The following are the scatter plot and residual plot based a dataset and a regrercion 02-
Q: Find the mean of the set of data below and construct a sampling distribution, without replacement an...
A: a)
Q: The table summartzes results from pedestrian deaths that were caused by automobile accidents. Pedest...
A:
Q: Suppose that the growth behavior of a native catfish is to be characterized. To understand the growt...
A: "Since you have asked multiple questions, we will solve the first question for you. If you want any ...
Q: o If for two events, A and B P(B) = and P(A/B) Then find P(B A). 4 %3D -
A: here as per policy I have calculated first main question as all questions are totally different here...
Q: Which of the following is true about Chi-square tests and F tests? [f] O Both measure the discrepanc...
A: Solution-: We find the true statement about the chi-square tests and F-tests?
Q: II. For each of the following, determine which graph to use 1. Ages of atten dees of CME bridging pr...
A: Since you have posted a question with multiple subparts, we will solve first three subparts for you....
Q: Given the probability mass function below. What is P(X > 4)? Sample point x 3 4 P(X-x) 1/9 2/9 3/9 2...
A: Given data is sample point x 1 2 3 4 5 P(X=x) 1/9 2/9 3/9 2/9 1/9
Q: 1. For parts a-c, state whether X follows a binomial distribution. If X is binomial, give the values...
A: Given,Total no.of toppings=16
Q: 3.1 If Y is a random variable with moment-generating function m(t) and if Z is given by Z = pY + q. ...
A:
Q: For a data set of the pulse rates for a sample of adult females, the lowest pulse rate is 33 beats p...
A: Hi! Thank you for the question, as per the honor code, we are allowed to answer three sub-parts at a...
Q: Consider a regression setting with input data XER® following a Gaussian distribution X~N(4, E). The ...
A:
Q: Consider a regression setting with input data XER® following a Gaussian distribution X~N(4, E). The ...
A:
Q: In a University of Minnesota study, 50 individuals with a rare cancer were followed for 24 months fr...
A: Given the follow up data of 50 individuals with a rare cancer for 24 months from date of diagnosis a...
Q: The pass result of 50 students who took up a test is given below : Marks No. of students 4 5 10 6. 9...
A:
Q: reg ln (income) UR Minimum_Wage Democrat Gov Welfare Gen In (emp) UR Minwage Source I SS df MS Numbe...
A: "Since you have posted a question with multiple sub-parts, we will solve the first three sub-parts f...
Q: According to Dietary Goals for the US (1977), high sodium intake may be related to ulcers, stomach c...
A: We have given that Sample size n =9 Sample mean =214 Standard deviation =7.5
Q: What is the probability that he wins on the second trial? A gambler decides to bet on “Red” until...
A: A gambler plays roulette at Monte Carlo and continues gambling. A gambler is wagering the same amoun...
Q: How do you determine which exam score is higher relative to others
A: The normal distribution is a continuous distribution.
Q: Illustration 11.20. Karl Pearson's coefficient of skewness of a distribution is +40. Its standard de...
A:
Q: 12% of all Americans live in poverty. If 31 Americans are randomly selected, find the probability th...
A: Note: According to Bartleby expert guidelines, we can answer only first question with their three su...
Q: of 7.9. What is the lower bound of the 95% confidence interval of the mean sodium content of the noo...
A: It is given that Sample size n = 9 Sample mean M = 208 Sample SD = 7.9 The critical value of t at df...
Q: If a student guesses randomly and independently, what is the probability that she is correct only on...
A: here given , there are 5 multiple choice question here p= probability of correct answer = 15 q =1-p...
Q: 5. 4. State the null hypothesis in symbols. Express the decision rule in terms of z.
A: ( 4 ) Null hypothesis in symbols H0 : mu =100 ( 5 ) Decision rule in terms of Z
Q: Round all answers to 4 decimal places. a. A bag contains 7 green marbles, 4 black marbles, and 10 re...
A:
Q: Question 9 of 11 Stacked O Attem It appears that people who are mildly obese are less active than l...
A: As per Bartleby guidelines I can't answer more than one question per post. Please post other questio...
Q: A food safety guideline is that the mercury in fish should be below 1 part per million (ppm). Liste...
A: We have given that, The data set is, 0.51, 0.72, 0.11, 0.91, 1.28, 0.53, 0.94 Then, We will find ...
Q: Which is true? - Typically we don't know U so we use sample mean to estimate U. - Typically we don...
A: Typically, U is unknown and in order to estimate the U, we obtain a sample to save our time as well ...
Q: two rejection regions one rejection region no rejection regions A two test statistics
A: Two tailed test:-A two tailed test is test in which critical region is kept on both sides of thenorm...
Q: 12. You are given the following data pertaining to kilowatt hours of electricity consumed by 100 per...
A: Given data is Consumption (in k watt hrs) 0-10 10-20 20-30 30-40 40-50 No.of users 6 25 36 20 1...
Q: 3.1 If Y is a random variable with moment-generating function m(t) and if Z is given by Z = pY + q. ...
A: Note: Hi, thank you for the question. As per our company guideline we are supposed to answer only fi...
Q: The following data relate to size of shoes sold at a store during a given week. Find the average siz...
A: x frequency (f) d =( X - A)/A = (X- 0.8)/0.5 A =8,h= 0.5 f.d 4.5 1 -7 -7 5 2 -6 -12 5.5 4 -5 -...
Q: In a sample with M = 60 and s = 10 a score of X = 70 corresponds to a z-score of z = +1.00 because i...
A:
Q: Problem 1: Asking Embarrassing Questions, Politely When doing polling, for instance to figure out ho...
A: Given information: 5) x = 70 n = 100 p^N=xN=70100=0.70
Q: Find the conditional PMF of Y , given X = x, for x = 0, 1, ..., 20.
A:
Q: Use the 95% confidence level and two-tailed test to ans 1. What is a? 2. Is the Central Limit Theore...
A: Here Given Sample mean=x¯=110 Sample sd=s=14 Sample size=n=50 Population mean=μ=100 Population sd=σ...
Q: a store during a given week. method. The following data relate to size of shoes sold at Find the ave...
A:
Q: Let E be the event that a corn crop has an infestation of ear worms, and let B be the event that a c...
A:
Q: a) Р(X > х) %3D 0.5. X = i b) Р(Х > х) %3D 0.95. = X i с) Р(х < X < 9) — 0.2. X = i
A: GivenMean(μ)=9standard devaition(σ)=2
Q: t was believed that 25% of the students have internet connection at home. How large a sample is nece...
A:
Q: Which of the following probability values corresponds to values of a normal random variable within p...
A: The empirical rule, also referred to as the three-sigma rule or 68-95-99.7 rule, is a statistical ru...
Q: This question uses data on the birth weight (measured in grams) of infants born in 2019. Ône sample ...
A:
Q: If the area to the left of x in a normal distribution is 0.842, what is the area to the right of x? ...
A:
Q: Thursday, March 17, 2022 9:50 AM To check pain-relieving medications for potential side effects on b...
A: Since you have asked multiple questions, we will solve the first question for you. If you want any s...
Q: The marketing director at Nike is interested in knowing whether there is an association between dail...
A: Hey there! Thank you for posting the question. Since your question has more than 3 parts, we are sol...
Q: Suppose that y; has distribution N(0;,o² = 1). (a) Write the pdf in the natural exponential family f...
A: (a) According to question, yi~Nθi, 1 and Natural exponential family form given in question is, fy...
Q: Problem 8. Calculate the Karl Pearson's coefficient of skew- ness from the following data : Marks ab...
A: Given data is x 0 10 20 30 40 50 60 70 80 f 150 140 100 80 80 70 30 14 0
Q: Given the table of probability mass function below, solve for the variance. 2 4 6. P(X= x) 0.05 0.05...
A:
Q: Determine the value of c. B. Solve for E[W^3]
A:
Q: formula for converting a normal distribution score to a standard normal distribution score?
A: Normal distribution is an important continuous probability distribution because, as sample size incr...
Q: A marriage counselor has traditionally seen that the proportion p of all married couples for who...
A:
Step by step
Solved in 2 steps
- If multicollinearity is perfect in a regression model the standard errors of the regression coefficients are Select one: Indeterminate small negative values Infinite values Determinate What is the meaning of the term "heteroscedasticity"? Select one: The variance of the errors is not constant The errors are not linearly independent of one another The errors have non-zero mean the variance of the dependent variable is not constant The coefficient estimated in the presence of heteroscedaticity are NOT Select one: Linear estimators Efficient estimators Unbiased estimators Consistent estimators Heteroscedaticity is more likely a problem of Select one: Pooled data cross-section data and time series data Cross-section data Time series data Near multicollinearity occurs when Select one: Two or more explanatory variables are perfectly correlated with one another The explanatory variables are highly correlated with the dependent variable The explanatory variables are highly…Create a multiple regression model with the total number of wins as the response variable, and average points scored, average relative skill, and average points differential as predictor variables. This regression model will help your coach predict how many games your team might win in a regular season based on metrics like the average score, average relative skill, and the average points differential between the team and their opponents. What is the Null Hypothesis (statistical notation and its description in words) Alternative Hypothesis (statistical notation and its description in words)Regression lines and correlation coefficient
- Consider the image a plot of a regression line. What do you call the regression line that results in the smallest sum of errors squared? a. correlational lineb. forecasting linec. least squares regression lined. Pearson's lineA concept used when interpreting partial correlation coefficients to indicate that a control variable appears to explain the relationship between two other variables completely A concept used in multiple regression and partial correlation to indicate that the effect of one independent variable on the dependent variable is different depending on the value of another independent variable A value that is computed for each independent variable in a multiple regression equation and is used in the equation as a multiplier to the value of the corresponding independent variable A statistical method that uses the least-squares method to produce an equation to predict the Z score of one variable using the Z scores of two or more other variables A value that describes the percentage of variability in the dependent variable that is explained by two or more independent variables A measure of the relationship between two variables without consideration of any other…What does the correlation matrix for a multiple regression analysis contain?A. Multiple correlation coefficientsB. Simple correlation coefficientsC. Multiple coefficients of determinationD. Multiple standard errors of estimate
- Linear Regression models can be optimised to avoid high variance by means of regularisations such as Lasso and Ridge. Explain when and why they are applied and the difference between both.What test of significance would you use for this case of bivariate or multivariate analysis? Assume that each variable is measured at its mostdetailed possible level of measurement. Meaning, for instance, that age is always ratio (0, 1, 2, 3, 4, 5, .... infinite), not ordinal (i.e., age categories).Effect of gender on average age of consumption of first alcoholic drink O T-testO ANOVAO Regression© Chi-squareCompute the value of the correlation coefficient for the data obtained in the study of the number of absences and the final grade of the seven students in the statistics class. Student. Number of absences. Also, find the equation of the regression line for the given data? Student. Number of absences. Final grade% ---------------------------------------------------------------------------- A. 6 82 B 2 86 C. 15 43 D. 9 74 E. 12 58 F 5 90 G 8 78
- The percentage of variation in the values of y explained by the least squares regression line is the correlation coefficient. the slope of the regression line. the coefficient of determination. ρ. the y-intercept of the regression line.Regarding least-squares regression line.Biologists are interested in how temperature changes might affect the frequency of mating calls of frogs. Twenty gray tree frogs are randomly chosen for a study. For each frog, the temperature of its habitat (in degrees Celsius) and the frequency of its mating call (in tones per second) are recorded. The 96 percent confidence interval for estimating the population slope of the linear regression line predicting mating call frequency based on habitat temperature is given by 2.341±0.7682.341±0.768. Assume that the conditions for inference for the slope of the regression line have been met. Which of the following is the correct interpretation of the calculated confidence interval? A. We are 96 percent confident that the increase in mating call frequency of an individual frog when its habitat temperature increases by 1 degree Celsius is between 1.573 and 3.109 tones per second. B. We are 96 percent confident that the average increase in mating call frequency in the sample of frogs when…