Find the P-value for the following values of the test statistic t, sample size n, and alternate hypothesis H,. Use the e Critical Values for the Student's t Distribution Table and specify that P is between two values. Part: 0/ 4 Part 1 of 4 When t=-2.188, n=20, and < P-value <
Find the P-value for the following values of the test statistic t, sample size n, and alternate hypothesis H,. Use the e Critical Values for the Student's t Distribution Table and specify that P is between two values. Part: 0/ 4 Part 1 of 4 When t=-2.188, n=20, and < P-value <

MATLAB: An Introduction with Applications
6th Edition
ISBN:9781119256830
Author:Amos Gilat
Publisher:Amos Gilat
Chapter1: Starting With Matlab
Section: Chapter Questions
Problem 1P

Related questions
Question
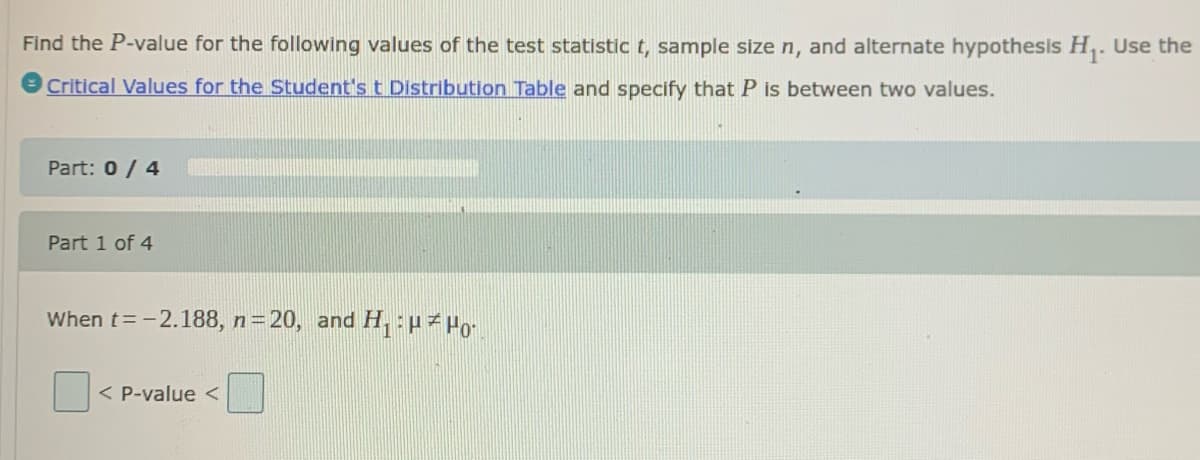
Find the P-value for the following values of the test statistic t, sample size n, and alternate hypothesis H,. Use the
@ Critical Values for the Student's t Distribution Table and specify that P is between two values.
![Critical Voluos for the Student's Distribution
Arca in Righl Tl
Degrees of
Freedem
0.40
D.13 4.10
0.025
0.0035
0.0016
0325 1000 304 6314 1LJ6 31621 6365) 127 32I 3LJ0 636619
0.29 0816 1.885 2930
0.117 0.765 1633 1353
0.271 0.741 1533 2.132
0.267 0.727 L47% 1015
0.165 0.718 140 1943
4303
9.925
14.089
7453
5.598
22.327
10.215
7173
3.403
31.599
12924
茎610
4.541
A747
5.541
4.604
4.062
2571
1447
165
3143
2.94
4.773
4317
4029
6869
5.059
5.406
5.041
4.741
9.
0.163 0.711 1415 A95
3.707
1499
7.
4.785
0.262 0706 1.39) 139)
0.361 0.703 1.8) 1A31
0360 0.700 1372 1J12
0.AN D 1363 1.J0
0.159 D05 1.355 1J82
0.159 0694 1.350 171
0.258 002 1345 1.761
0.15% DA1 1341 1753
0.358 DG0 133) 1.746
0.157 1689 1331 1.74
0.257 064 130 1.734
0357 0688 1324 1.72
3.355
ま250
2306
2.596
4.297
10
2.761
Z713
3.591
1201
1.025
4437
12
3005
3012
297)
297
2921
1930
1.452
3.787
3.333
168
4.318
4221
4140
403
4015
065
2650
2624
3372
15
16
17
2145
1.131
1.101
2.110
2.601
3.286
7252
3.212
2567
2.551
2539
1525
2874
2.861
2.845
2.831
2.819
2.S07
2.101
1.003
1.06
3197
3474
3153
3.022
19
3.59
20
3552
3850
0.357 0686 1321 1.721
21
22
23
1.080
2.074
2.069
2.513
1505
2.500
3135
3119
1527
3104
3485
3.768
0.156 0685 1314 1.7||
2.064
2.791
2.492
2.485
2479
2.473
3.091
3.078
3.067
3057
3745
3.725
3.70T
25
26
1.060
2.006
2012
2.78]
3.450
3.435
3421
0256 0644 1315 1706
0.156 0614 B4 1.703
0.256 0.683 133 1201
0136 0643 13ILIA9
2.79
2.771
2.763
2756
2790
27
2.463
2048
2045
1042
1.040
2037
1035
2032
2030
3.4N
3674
3.659
3646
3633
29
3038
3030
30
3.385
31
32
0.256 0682 1309 16NG
0.255 D632 130 1604
0.255 0642 1308 1592
0255 0682 1301 16I
0.155 0682 L06
3453
2744
2 T33
1733
2129
1.124
2T19
3012
3015
2449
3.365
33%
3611
A601
OPEE
3.591
1434
296
36
113
0.255 0681 1305 L687
0255 D681 1.304 L68
0.255 0681 1.304 168S
1303 1684
0.255 09 1299 167G
354
3.566
39
40
50
2034
2003
2.021
1429
1426
3436
2971
2017
2915
3.307
3.261
1332
3.195
3.551
3.496
3.460
0254 0678 1292 16
1491 96 690 50
1990
1639
2.626
2.601
2.576
100
3.390
3.340
3201
2364
200
0.154 0.676 12%6 165a
0.253 0674 1.282 164
1972
2839
2.307
2326
196%
3.000](/v2/_next/image?url=https%3A%2F%2Fcontent.bartleby.com%2Fqna-images%2Fquestion%2F34827f9e-db66-41dc-a872-803b52f16b08%2F89648100-be61-466a-87df-e1f31d7ade42%2Fhno62c_processed.jpeg&w=3840&q=75)
Transcribed Image Text:Critical Voluos for the Student's Distribution
Arca in Righl Tl
Degrees of
Freedem
0.40
D.13 4.10
0.025
0.0035
0.0016
0325 1000 304 6314 1LJ6 31621 6365) 127 32I 3LJ0 636619
0.29 0816 1.885 2930
0.117 0.765 1633 1353
0.271 0.741 1533 2.132
0.267 0.727 L47% 1015
0.165 0.718 140 1943
4303
9.925
14.089
7453
5.598
22.327
10.215
7173
3.403
31.599
12924
茎610
4.541
A747
5.541
4.604
4.062
2571
1447
165
3143
2.94
4.773
4317
4029
6869
5.059
5.406
5.041
4.741
9.
0.163 0.711 1415 A95
3.707
1499
7.
4.785
0.262 0706 1.39) 139)
0.361 0.703 1.8) 1A31
0360 0.700 1372 1J12
0.AN D 1363 1.J0
0.159 D05 1.355 1J82
0.159 0694 1.350 171
0.258 002 1345 1.761
0.15% DA1 1341 1753
0.358 DG0 133) 1.746
0.157 1689 1331 1.74
0.257 064 130 1.734
0357 0688 1324 1.72
3.355
ま250
2306
2.596
4.297
10
2.761
Z713
3.591
1201
1.025
4437
12
3005
3012
297)
297
2921
1930
1.452
3.787
3.333
168
4.318
4221
4140
403
4015
065
2650
2624
3372
15
16
17
2145
1.131
1.101
2.110
2.601
3.286
7252
3.212
2567
2.551
2539
1525
2874
2.861
2.845
2.831
2.819
2.S07
2.101
1.003
1.06
3197
3474
3153
3.022
19
3.59
20
3552
3850
0.357 0686 1321 1.721
21
22
23
1.080
2.074
2.069
2.513
1505
2.500
3135
3119
1527
3104
3485
3.768
0.156 0685 1314 1.7||
2.064
2.791
2.492
2.485
2479
2.473
3.091
3.078
3.067
3057
3745
3.725
3.70T
25
26
1.060
2.006
2012
2.78]
3.450
3.435
3421
0256 0644 1315 1706
0.156 0614 B4 1.703
0.256 0.683 133 1201
0136 0643 13ILIA9
2.79
2.771
2.763
2756
2790
27
2.463
2048
2045
1042
1.040
2037
1035
2032
2030
3.4N
3674
3.659
3646
3633
29
3038
3030
30
3.385
31
32
0.256 0682 1309 16NG
0.255 D632 130 1604
0.255 0642 1308 1592
0255 0682 1301 16I
0.155 0682 L06
3453
2744
2 T33
1733
2129
1.124
2T19
3012
3015
2449
3.365
33%
3611
A601
OPEE
3.591
1434
296
36
113
0.255 0681 1305 L687
0255 D681 1.304 L68
0.255 0681 1.304 168S
1303 1684
0.255 09 1299 167G
354
3.566
39
40
50
2034
2003
2.021
1429
1426
3436
2971
2017
2915
3.307
3.261
1332
3.195
3.551
3.496
3.460
0254 0678 1292 16
1491 96 690 50
1990
1639
2.626
2.601
2.576
100
3.390
3.340
3201
2364
200
0.154 0.676 12%6 165a
0.253 0674 1.282 164
1972
2839
2.307
2326
196%
3.000
Transcribed Image Text:Find the P-value for the following values of the test statistic t, sample size n, and alternate hypothesis H,. Use the
Critical Values for the Student's t Distribution Table and specify that P is between two values.
Part: 0/ 4
Part 1 of 4
When t=-2.188, n=20, and H, :µz Po-
< P-value <
Expert Solution
This question has been solved!
Explore an expertly crafted, step-by-step solution for a thorough understanding of key concepts.

Step by step
Solved in 2 steps with 2 images

Recommended textbooks for you
MATLAB: An Introduction with Applications
Statistics
ISBN:
9781119256830
Author:
Amos Gilat
Publisher:
John Wiley & Sons Inc

Probability and Statistics for Engineering and th…
Statistics
ISBN:
9781305251809
Author:
Jay L. Devore
Publisher:
Cengage Learning

Statistics for The Behavioral Sciences (MindTap C…
Statistics
ISBN:
9781305504912
Author:
Frederick J Gravetter, Larry B. Wallnau
Publisher:
Cengage Learning
MATLAB: An Introduction with Applications
Statistics
ISBN:
9781119256830
Author:
Amos Gilat
Publisher:
John Wiley & Sons Inc
Probability and Statistics for Engineering and th…
Statistics
ISBN:
9781305251809
Author:
Jay L. Devore
Publisher:
Cengage Learning
Statistics for The Behavioral Sciences (MindTap C…
Statistics
ISBN:
9781305504912
Author:
Frederick J Gravetter, Larry B. Wallnau
Publisher:
Cengage Learning

Elementary Statistics: Picturing the World (7th E…
Statistics
ISBN:
9780134683416
Author:
Ron Larson, Betsy Farber
Publisher:
PEARSON

The Basic Practice of Statistics
Statistics
ISBN:
9781319042578
Author:
David S. Moore, William I. Notz, Michael A. Fligner
Publisher:
W. H. Freeman

Introduction to the Practice of Statistics
Statistics
ISBN:
9781319013387
Author:
David S. Moore, George P. McCabe, Bruce A. Craig
Publisher:
W. H. Freeman