Find the range, variance and standard deviation of the following grouped data. 1. The following table shows the distribution of the number of hours worked each week (on average) for a sample of 100 community college students. Hours Worked per Week | Number of Students 0-9 24 10 - 19 14
Find the range, variance and standard deviation of the following grouped data. 1. The following table shows the distribution of the number of hours worked each week (on average) for a sample of 100 community college students. Hours Worked per Week | Number of Students 0-9 24 10 - 19 14

Glencoe Algebra 1, Student Edition, 9780079039897, 0079039898, 2018
18th Edition
ISBN:9780079039897
Author:Carter
Publisher:Carter
Chapter10: Statistics
Section10.5: Comparing Sets Of Data
Problem 11PPS

Related questions
Question
answer asap with solution
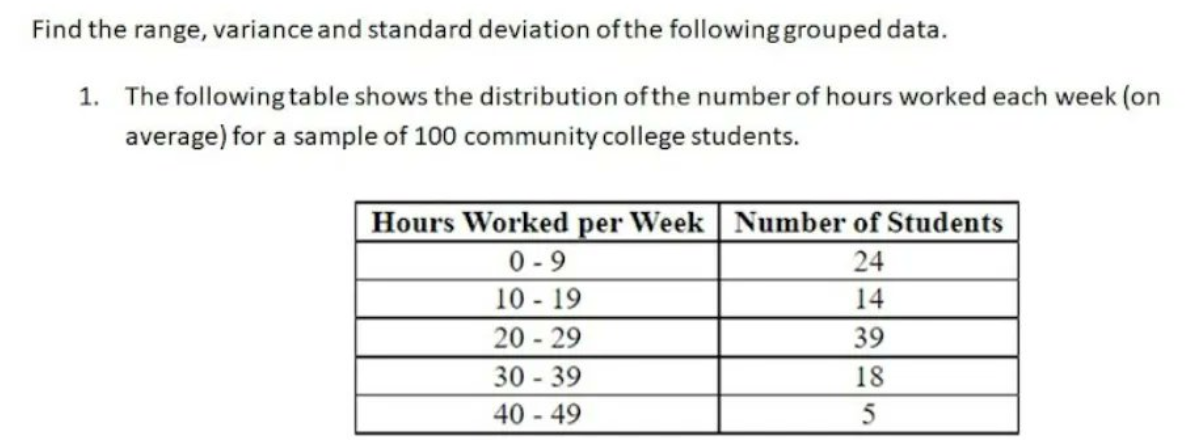
Transcribed Image Text:Find the range, variance and standard deviation of the following grouped data.
1. The following table shows the distribution of the number of hours worked each week (on
average) for a sample of 100 community college students.
Hours Worked per Week Number of Students
0 - 9
10 - 19
20 - 29
24
14
39
30 39
18
40 - 49
Expert Solution
This question has been solved!
Explore an expertly crafted, step-by-step solution for a thorough understanding of key concepts.

This is a popular solution!

Trending now
This is a popular solution!

Step by step
Solved in 2 steps

Recommended textbooks for you
Glencoe Algebra 1, Student Edition, 9780079039897…
Algebra
ISBN:
9780079039897
Author:
Carter
Publisher:
McGraw Hill
Glencoe Algebra 1, Student Edition, 9780079039897…
Algebra
ISBN:
9780079039897
Author:
Carter
Publisher:
McGraw Hill