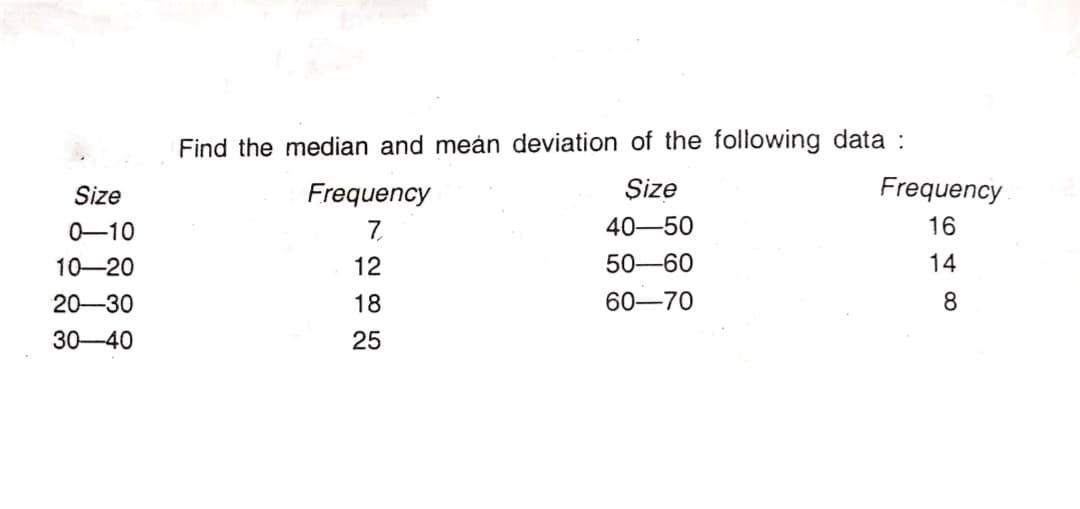
Find the median and meản deviation of the following data : Size Frequency Şize Frequency 0-10 7 40-50 16 10-20 12 50-60 14 20-30 18 60–70 8 30-40 25


Q: The table below displays the (mean) maximum July temperature measured over ten years at the Armagh…
A:
Q: From the following data compute Quartile Deviation : Size : 4- 7 8-10 11-13 14-16 17-19 Frequency 14…
A:
Q: Calculate the mean deviation and its coefficient from the following data : Class Frequency Class…
A: Given that data I want to find coefficients of mean deviation. Mean = sum of all…
Q: The data below shows the ages of employees in a company for raising ruminants. 37 37 36 36 36 36 36…
A: Stem Leaf Plot: The represented is the stem leaf plot for the data.
Q: Look for the following: Mean, Median, Mode, Variance, Standard Deviation, and z-score. Class…
A: We have given a grouped data table consisting class intervel and frequency, We have to find out,…
Q: For the following data set, approximate the sample standard deviation frequency table shows phone…
A:
Q: Suppose a mathematics class with 30 students is given an examination and the raw scores are shown…
A: Note, Since you have posted a question with multiple sub-parts, we will solve first three sub-parts…
Q: Compute Quartile Deviation of the following data: Wages 100 140 180 200 240 300 320 Workers 10 16 14…
A: Given data is Wages 100 140 180 200 240 300 320 Workers 5 7 10 16 14 8 4
Q: The following data provide the time in months from hire to promotion to manager f 25 software…
A:
Q: Calculate standard deviation from the following data. Marks Frequency | 6 0-10 10-20 20-30 30-40…
A: Class Interval Frequency, f Midpoint, x fx x2 fx2 0-10 6 5 30 25 150 10-20 8 15 120 225 1800…
Q: For the following data set, approximate the sample standard deviation of emails per day, rounding to…
A: Solution:
Q: 3 13 Calculate the mean deviation (from median) from the following data :- Class interval Frequency…
A:
Q: The following data represents the age distribution of a sample of 100 people covered by Health…
A: Note: Hey there! Thank you for the question. As you have posted a question with multiple sub-parts,…
Q: Find the mean, variance and standard deviation of the following data: X 19 20 21 22 23 P(X) 0.2 0.2…
A: The table shows the X values and its probabilities values.
Q: This data is from a sample. Calculate the mean, standard deviation, and coefficient of variation.…
A: Number of samples (n) = 7 X 48.3 29.6 16.8 42.9 41.4 13.2 29.5
Q: A. Consider the following sample with 20 observations: 1 1 5 7 9 11 20 21 23 28 28 31 11 39 (i)…
A: I solved exactly first three subparts because of bartleby policy if you want more please upload…
Q: Calculate the mean deviation and its coefficient from the following data : Class Frequency Class…
A:
Q: Calculate standard deviation and its coefficient of variation from the following data : Measurements…
A: Class Frequency (f) Mid value (x) f⋅x f⋅x2 0-5 4 2.5 10 25 5-10 1 7.5 7.5 56.25 10-15 10…
Q: ) Consider the following ungrouped data: 41 46 7 46 32 5 14 28 48 49 8 49 48 25 41 8 22 46 40 48…
A:
Q: 2. Given the following sample statistical data: 120 135 156 200 177 179 165 134 167 155 185 181 139…
A: Given, Formula Used: 1) Range = Maximum - minimum 2) Mean = Sum of all observations divided by…
Q: Here is a FDT for a small data set: data freq 12 1 13 3. 14 3. 15 16 9. Find the following measures…
A:
Q: Find the standard deviation for the grouped data. College Units Frequency 0-24 4 25-49 3 50-74 6…
A: Here we use simple method which is used to find deviation
Q: Find the range, variance and standard deviation of the following grouped data. 1. The following…
A:
Q: Calculate the variance and standard deviation for the students score data. Score 10-14 15-19 20-24…
A: Obtain the value of the standard deviation for the students score data. The value of the standard…
Q: Calculate Standard deviation of the following data. No. of Employees : 10-19 20-29 50-59 3. 30-39…
A: Create a table with column labels Class interval, frequency (f), midpoint (x), fx, and fx2.…
Q: Calculate Standard deviation of the following data : No. of Employees : 10-19 20-29 30-39 40-49…
A: Given: No. of employees No of firms 10-19 6 20-29 11 30-39 14 40-49 6 50-59 3
Q: Find the range, variance and standard deviation of the following grouped data. 2. The following data…
A: Solution: The frequency distribution table is Rainfall ( inches ) Class Boundary Number of…
Q: For the data below construct the frequency distribution table with 5 classes and after that find: 1)…
A: Given data is appropriate for measures of central tendency to find the central value for the given…
Q: Find the median and mean deviation of the following data; Frequency 7 12 15 25 Size 40-50 50-60…
A:
Q: This data is from a sample. Calculate the mean, standard deviation, and coefficient of variation.…
A: Number of samples (n) = 7 X 16.2 33.3 15.4 25 32.4 20.5 31.6
Q: Consider the following data: 62 61 83 92 67 89 83 50 80 69 95 50 73 71 73 88 66 89 73 51 58 86 73…
A: 1) Hi! Thank you for the question, As per the honor code, we are allowed to answer three sub-parts…
Q: Q) Consider the following ungrouped data: 41 46 7 46 32 5 14 28 48 49 8 49 48 25 41 8 22 46 40 48…
A: Arithmetic mean : Arithmetic mean is the sum of all observations divided by total number of…
Q: Find the sample mean, sample variance, and sample standard deviation of the given data set: 1. 4 10…
A:
Q: For this grouped data set: Scores | Frequencies 30-34 | 7 25-29 |…
A:
Q: Look for the following: Mean, Median, Mode, Variance Standard Deviation, and z-score. Class…
A:
Q: Use the grouped data formulas to find the indicated mean or standard deviation. For the following…
A: Given data is Height (in inches) Frequency 50 - 52 5 53 - 55 8 56 - 58 12 59 - 61 13 62…
Q: Calculate Quartile Deviation and coefficient of Quartile Deviation from the following data : Age in…
A:
Q: Which is the largest with regard to the following data set: the range or the standard deviation? 11…
A: We have given that, X :- 11, 11, 12, 12, 12, 12, 13, 15, 17, 22, 22, 22 Then, We will check which…
Q: Determine the following: ● Mean ● Median Mode • Standard deviation Variance ● Class interval 30-34…
A: Given data is Class Interval Frequency 30 - 34 3 35 - 39 6 40 - 44 7 45 - 49 12 50 - 54…
Q: a) Calculate the Median, Mode and standard deviation of the following data 71 Weights 63 65 66 67 68…
A: Let xi be the value and fi be the frequency associated with value xi . Weights (xi) 63 64 65 66…
Q: 28. (a) Find the median and meán deviation of the following data : Size Frequency Size Frequency…
A:
Q: Calculate the mean deviation and its coefficient both from mean and median for the following. Marks:…
A:
Q: Calculate the mean deviation (from median) from the following data : Class interval Frequency Class…
A:
Q: Q) Consider the following ungrouped data: 18 11 22 19 24 24 23 10 11 16…
A: Mean is the average value around which the whole data set is concentrated. Mean for the set of 'n'…
Q: 2. Find the range and sample variance of the following numbers: 12 13 45 16 12 12 10 10 13 15 3.…
A: The question is about descriptive statistics
Q: Calculate the mean deviation from the mean for the following distribution : Marks No. of students :…
A:
Q: Consider the following data: 62 61 83 92 67 89 83 50 80 69 95 50 73 71 73 88 66 89 73 51 58 86 73…
A: Given data is appropriate for measures of central tendency and measures of dispersion. Measures of…
Q: Calculate the mean, standard deviation and variance for the following frequency distribution. 40-50…
A: The grouped data information provided, with the corresponding frequencies is shown in the table…
Q: Find the mean, variance, and standard deviation of the following sets of data. 1. 11 15 19 23 27 31…
A: Given two data sets and we have to find the mean, variance and standard deviation of the data sets.
Q: calculate the standard deviation for the data in the table Range Frequency 1-10 11-20 7. 21-30 10…
A: We have to find the standard deviation.

Step by step
Solved in 3 steps with 3 images
