Find the regression equation, letting the first variable be the predictor (x) variable. Using the listed lemon/crash data, where lemon imports are in metric tons and the fatality rates are per 100,000 people, find the best predicted crash fatality rate for a year in which there are 425 metric tons of lemon imports. Is the prediction worthwhile? Lemon Imports Crash Fatality Rate 15.9 15.6 226 270 362 482 524 15.3 15.3 14.8 Find the equation of the regression line. (Round the y-intercept to three decimal places as needed. Round the slope to four decimal places as needed.) The best predicted crash fatality rate for a year in which there are 425 metric tons of lemon imports is fatalities per 100,000 population. (Round to one decimal place as needed.) Is the prediction worthwhile? O A. Since common sense suggests there should not be much of a relationship between the two variables, the prediction does not make much sense. O B. Since the sample size is small, the prediction is not appropriate. O C. Since there appears to be an outlier, the prediction is not appropriate. O D. Since all of the requirements for finding the equation of the regression line are met, the prediction is worthwhile.
Find the regression equation, letting the first variable be the predictor (x) variable. Using the listed lemon/crash data, where lemon imports are in metric tons and the fatality rates are per 100,000 people, find the best predicted crash fatality rate for a year in which there are 425 metric tons of lemon imports. Is the prediction worthwhile? Lemon Imports Crash Fatality Rate 15.9 15.6 226 270 362 482 524 15.3 15.3 14.8 Find the equation of the regression line. (Round the y-intercept to three decimal places as needed. Round the slope to four decimal places as needed.) The best predicted crash fatality rate for a year in which there are 425 metric tons of lemon imports is fatalities per 100,000 population. (Round to one decimal place as needed.) Is the prediction worthwhile? O A. Since common sense suggests there should not be much of a relationship between the two variables, the prediction does not make much sense. O B. Since the sample size is small, the prediction is not appropriate. O C. Since there appears to be an outlier, the prediction is not appropriate. O D. Since all of the requirements for finding the equation of the regression line are met, the prediction is worthwhile.

Functions and Change: A Modeling Approach to College Algebra (MindTap Course List)
6th Edition
ISBN:9781337111348
Author:Bruce Crauder, Benny Evans, Alan Noell
Publisher:Bruce Crauder, Benny Evans, Alan Noell
Chapter3: Straight Lines And Linear Functions
Section3.CR: Chapter Review Exercises
Problem 15CR: Life Expectancy The following table shows the average life expectancy, in years, of a child born in...

Related questions
Question
4.
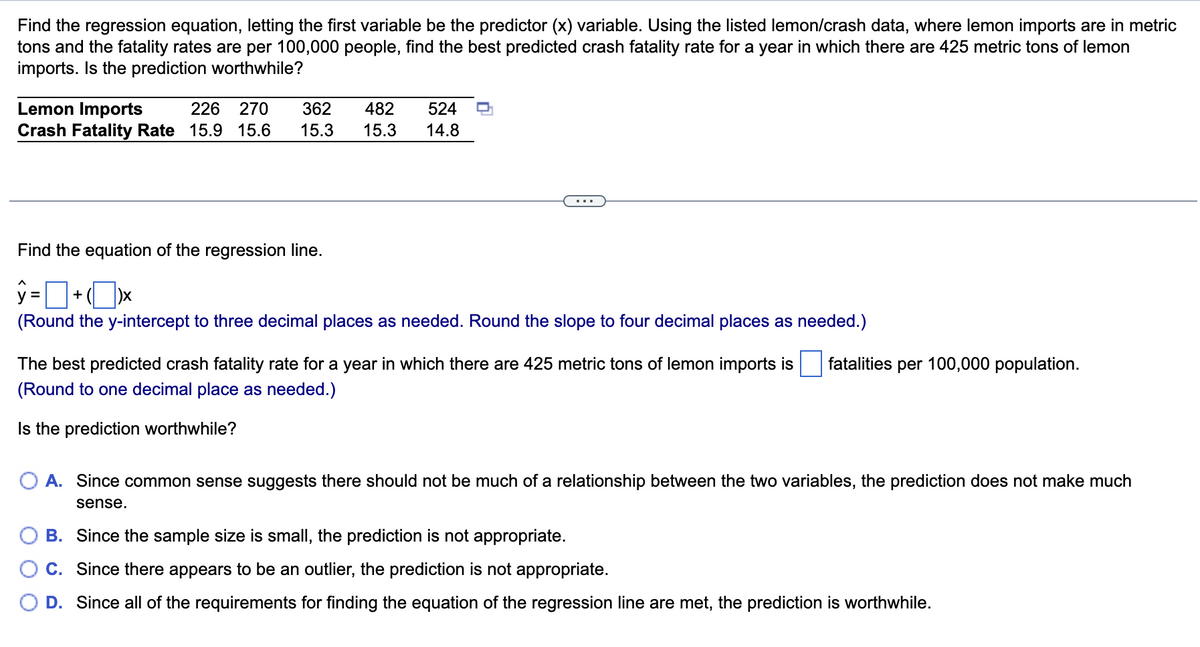
Transcribed Image Text:Find the regression equation, letting the first variable be the predictor (x) variable. Using the listed lemon/crash data, where lemon imports are in metric
tons and the fatality rates are per 100,000 people, find the best predicted crash fatality rate for a year in which there are 425 metric tons of lemon
imports. Is the prediction worthwhile?
Lemon Imports
Crash Fatality Rate 15.9 15.6
226
270
362
482
524
15.3
15.3
14.8
...
Find the equation of the regression line.
y =
+
(Round the y-intercept to three decimal places as needed. Round the slope to four decimal places as needed.)
The best predicted crash fatality rate for a year in which there are 425 metric tons of lemon imports is
fatalities per 100,000 population.
(Round to one decimal place as needed.)
Is the prediction worthwhile?
A. Since common sense suggests there should not be much of a relationship between the two variables, the prediction does not make much
sense.
B. Since the sample size is small, the prediction is not appropriate.
C. Since there appears to be an outlier, the prediction is not appropriate.
D. Since all of the requirements for finding the equation of the regression line are met, the prediction is worthwhile.
Expert Solution
This question has been solved!
Explore an expertly crafted, step-by-step solution for a thorough understanding of key concepts.

This is a popular solution!

Trending now
This is a popular solution!

Step by step
Solved in 2 steps

Recommended textbooks for you
Functions and Change: A Modeling Approach to Coll…
Algebra
ISBN:
9781337111348
Author:
Bruce Crauder, Benny Evans, Alan Noell
Publisher:
Cengage Learning


Glencoe Algebra 1, Student Edition, 9780079039897…
Algebra
ISBN:
9780079039897
Author:
Carter
Publisher:
McGraw Hill
Functions and Change: A Modeling Approach to Coll…
Algebra
ISBN:
9781337111348
Author:
Bruce Crauder, Benny Evans, Alan Noell
Publisher:
Cengage Learning
Glencoe Algebra 1, Student Edition, 9780079039897…
Algebra
ISBN:
9780079039897
Author:
Carter
Publisher:
McGraw Hill

Algebra & Trigonometry with Analytic Geometry
Algebra
ISBN:
9781133382119
Author:
Swokowski
Publisher:
Cengage

Big Ideas Math A Bridge To Success Algebra 1: Stu…
Algebra
ISBN:
9781680331141
Author:
HOUGHTON MIFFLIN HARCOURT
Publisher:
Houghton Mifflin Harcourt