-Find the regression equation. (write the letter of the right answer (a,b,c. Final examination -4.34 + 0.7222PrelimExamination +1.3375MidtermExamination
-Find the regression equation. (write the letter of the right answer (a,b,c. Final examination -4.34 + 0.7222PrelimExamination +1.3375MidtermExamination

Glencoe Algebra 1, Student Edition, 9780079039897, 0079039898, 2018
18th Edition
ISBN:9780079039897
Author:Carter
Publisher:Carter
Chapter4: Equations Of Linear Functions
Section4.6: Regression And Median-fit Lines
Problem 17HP

Related questions
Question
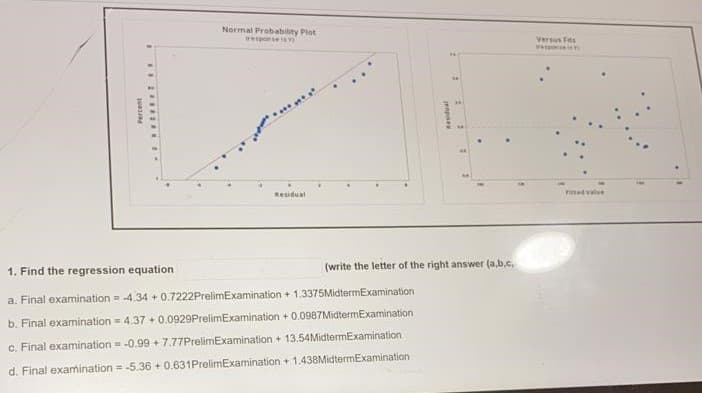
Transcribed Image Text:Normal Probability Plot
treponse
Versus Fts
Residual
Ped vale
1. Find the regression equation
(write the letter of the right answer (a,b.c.
a. Final examination = -4.34 + 0.7222PrelimExamination + 1.3375MidtermExamination
b. Final examination = 4.37 + 0.0929PrelimExamination + 0.0987MidtermExamination
c. Final examination = -0.99 + 7.77PrelimExamination + 13.54MidtermExamination
d. Final examination = -5.36 + 0.631PrelimExamination + 1.438MidtermExamination
Percent
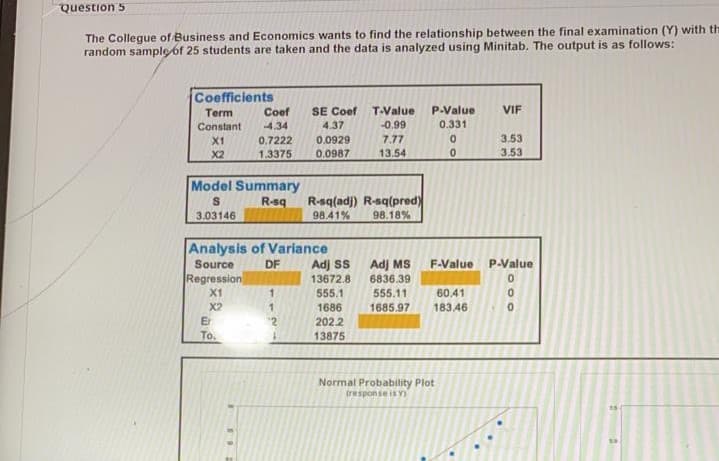
Transcribed Image Text:Question 5
The Collegue of Business and Economics wants to find the relationship between the final examination (Y) with th
random sample of 25 students are taken and the data is analyzed using Minitab. The output is as follows:
Coefficients
SE Coef
T-Value
P-Value
0.331
VIF
Term
Coef
Constant
4.34
4.37
-0.99
3.53
0,7222
1.3375
X1
0.0929
7.77
X2
0.0987
13.54
3.53
Model Summary
R-sq
R-sq(adj) R-sq(pred)
3.03146
98.41%
98.18%
Analysis of Variance
Source
Regression
X1
Adj ss
13672.8
Adj MS
6836.39
DF
F-Value
P-Value
1.
555.1
555.11
60.41
X2
1686
1685.97
183.46
Er
2022
To.
13875
Normal Probability Plot
tresponse is Y
Expert Solution
This question has been solved!
Explore an expertly crafted, step-by-step solution for a thorough understanding of key concepts.

Step by step
Solved in 2 steps

Recommended textbooks for you
Glencoe Algebra 1, Student Edition, 9780079039897…
Algebra
ISBN:
9780079039897
Author:
Carter
Publisher:
McGraw Hill
Glencoe Algebra 1, Student Edition, 9780079039897…
Algebra
ISBN:
9780079039897
Author:
Carter
Publisher:
McGraw Hill