Find the regression line associated with the set of points. (Round all coefficients to four decimal places.) HINT [See Example 2.] (-1,0), (2, 2), (7, 7) y(x) = 0.875x+0.875 X
Find the regression line associated with the set of points. (Round all coefficients to four decimal places.) HINT [See Example 2.] (-1,0), (2, 2), (7, 7) y(x) = 0.875x+0.875 X

Chapter4: Linear Functions
Section4.3: Fitting Linear Models To Data
Problem 7SE: A regression was run to determine whether there is arelationship between the diameter of a tree (x,...

Related questions
Question
100%
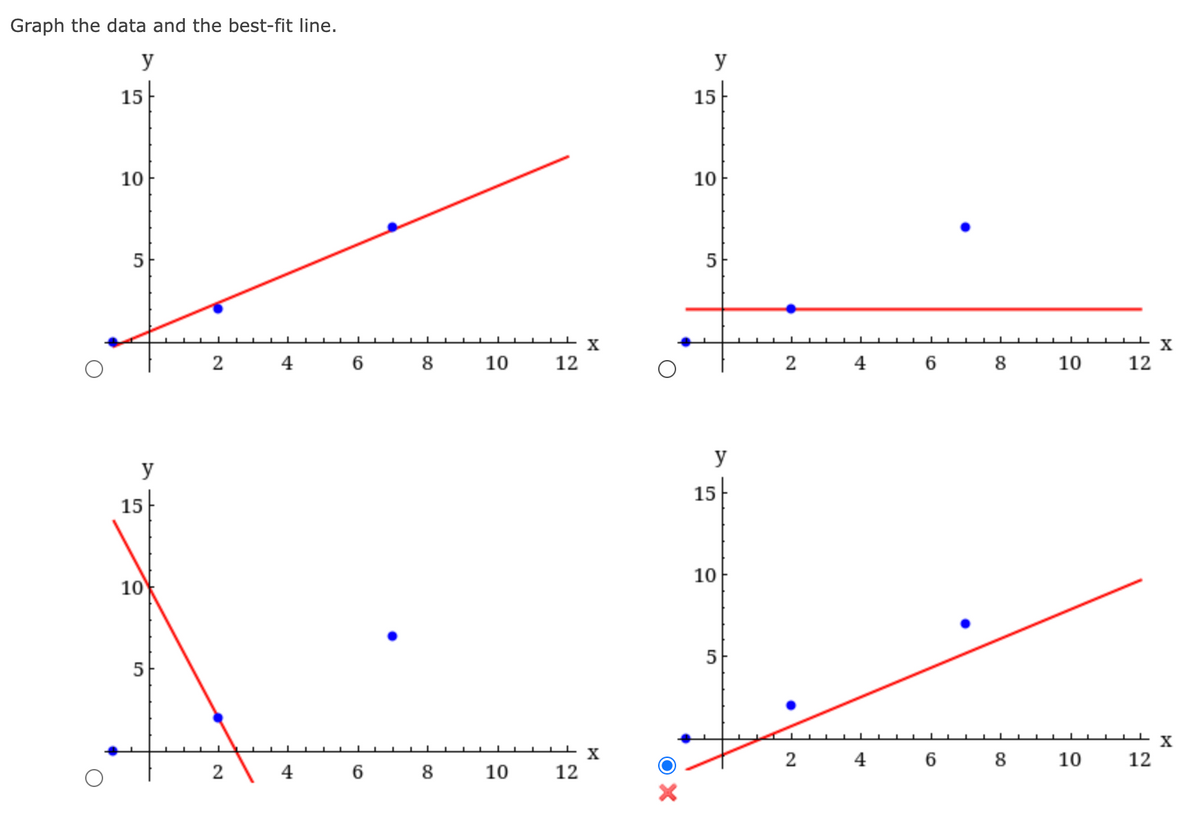
Transcribed Image Text:Graph the data and the best-fit line.
y
O
15
10
5
у
15
10
5
2
2
N
6 8
6 8
10
10
12
X
- X
12
хо
у
15
10
5
у
15
10
5
2
2
4
4
6 8 10
6 8
10
12
12
X
X
![Find the regression line associated with the set of points. (Round all coefficients to four decimal places.) HINT [See Example 2.]
(−1, 0), (2, 2), (7, 7)
y(x) = 0.875x+0.875
X](/v2/_next/image?url=https%3A%2F%2Fcontent.bartleby.com%2Fqna-images%2Fquestion%2F37af5c0e-0967-45c2-a51d-182f3c52a88e%2Ff8ed479a-2a9b-4c30-9e9e-ea8a67e5df28%2Fgidja4i_processed.png&w=3840&q=75)
Transcribed Image Text:Find the regression line associated with the set of points. (Round all coefficients to four decimal places.) HINT [See Example 2.]
(−1, 0), (2, 2), (7, 7)
y(x) = 0.875x+0.875
X
Expert Solution
This question has been solved!
Explore an expertly crafted, step-by-step solution for a thorough understanding of key concepts.

This is a popular solution!

Trending now
This is a popular solution!

Step by step
Solved in 4 steps with 4 images

Recommended textbooks for you

Algebra & Trigonometry with Analytic Geometry
Algebra
ISBN:
9781133382119
Author:
Swokowski
Publisher:
Cengage

Glencoe Algebra 1, Student Edition, 9780079039897…
Algebra
ISBN:
9780079039897
Author:
Carter
Publisher:
McGraw Hill
Algebra & Trigonometry with Analytic Geometry
Algebra
ISBN:
9781133382119
Author:
Swokowski
Publisher:
Cengage
Glencoe Algebra 1, Student Edition, 9780079039897…
Algebra
ISBN:
9780079039897
Author:
Carter
Publisher:
McGraw Hill

Functions and Change: A Modeling Approach to Coll…
Algebra
ISBN:
9781337111348
Author:
Bruce Crauder, Benny Evans, Alan Noell
Publisher:
Cengage Learning


College Algebra
Algebra
ISBN:
9781305115545
Author:
James Stewart, Lothar Redlin, Saleem Watson
Publisher:
Cengage Learning