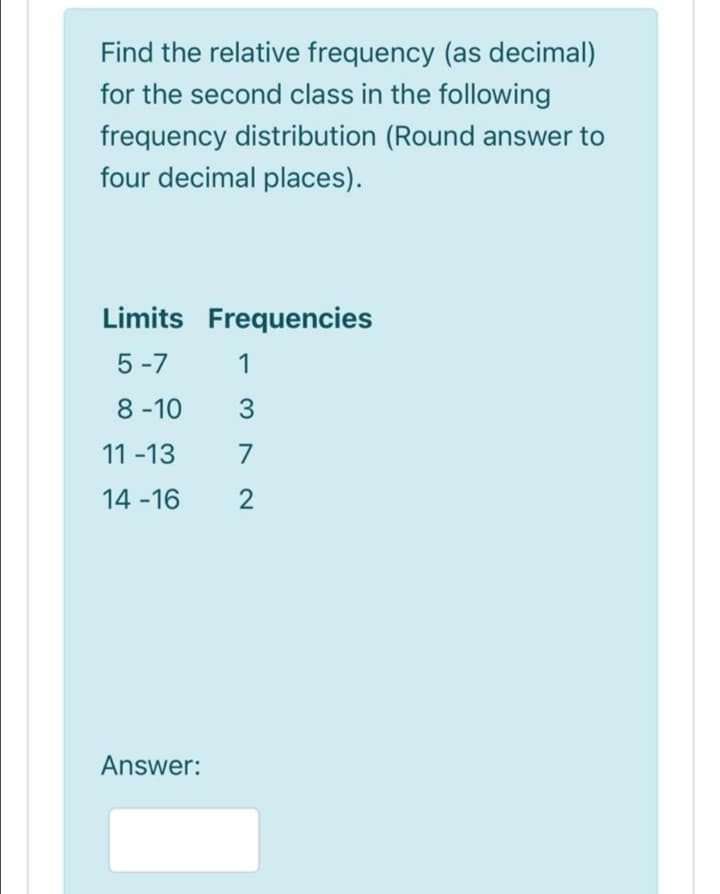
Find the relative frequency (as decimal) for the second class in the following frequency distribution (Round answer to four decimal places).


Q: Examine the frequency distribution. Commission Frequency last month $500-$749 8 $750-$999 12…
A:
Q: For the following grouped frequency distribution table of exam scores, how many students had scores…
A: Given data, How many students scored higher than X=54?
Q: In any relative frequency distribution, the sum of all the relative frequencies is always equal to 1…
A: The relative frequency is obtained as: relative frequency = class frequencytotal frequency…
Q: In a grouped frequency distribution, a cumulative percentage of 80% corresponds to the interval 5-9.…
A: The kth percentile can be interpreted as, value at or below which at least k percent of the…
Q: Find the mode of the frequency distribution shown in Activity 2
A: Given : Class interval f 15 - 24 5 25 - 34 10 35 - 44 11 45 - 54 23 55 - 64 26 65 -…
Q: Find the mean for the data items in the
A: It is an important part of statistics. It is widely used.
Q: Among fatal plane crashes that occurred during the past 60 years, 467 were due to pilot error, 82…
A: From the given information, observe that among fatal crashes that occurred during the past 60 years,…
Q: What is the highest score that anyone achieved in the data shown on the frequency distribution table…
A:
Q: Construct a grouped frequency distribution for the data to the right, showing the length, in miles,…
A: Given that
Q: The 50th percentile for the following data is 65, 70, 67, 75, 89, 80 O A. 67 O B. 75 OC. 72.5 O D.…
A: The given data set is, 65, 70, 67, 75, 89, 80 First, sort the values of data set. The sorted values…
Q: Find the median for the data items in the given frequency distribution Score, X Frequency, f 6 4 6 2…
A: First, we will find the sum of the given frequency and then will check at which position the score…
Q: 15c) Find the mode for the scores in the following frequency distribution table: Cumulative Number…
A:
Q: Construct the corresponding relative frequency distribution for the given frequency distributio
A: The relative frequency can be calculated as Relative frequency = frequency/Total frequency
Q: Find the mean of the following sets of data.
A:
Q: b. Using a class width of 10, develop a frequency distribution of the data starting with 30–39.9,…
A: Given data : Airport (Airport Code) Total Passengers (Millions) Boston Logan (BOS) 36.3…
Q: In the following frequency distribution table, if you know that The standard deviation, S of this…
A: Given Data : Class Frequency 4 - 6 3 7 - 9 18 10 - 12 10 13 - 15 7 For calculating the…
Q: Find the missing value in the following frequency distribution table. Cumulative Class Frequency…
A:
Q: The objective of building a frequency distribution is to find a meaningful pattern in the data,…
A: Given data: The objective of building a frequency distribution is to find a meaningful pattern in…
Q: Complete the frequency distribution shown below.
A: The midpoint is obtained below:The formula for midpoint is,Midpoint = Upper bound + Lower bound /…
Q: For the following frequency distribution of quiz scores, how many individuals took the quiz? Write…
A:
Q: For the following frequency distribution, how many individual scores are in the entire set?
A: In this question, we use the given frequency table to find the * total score * sum of x The…
Q: Given the following frequency distributions, fill in the missing frequencies and calculate the…
A: Given: N=52
Q: Classify the data and construct a frequency distribution by completing the following table: Class…
A:
Q: Create a relative frequency distribution and round the answers to two decimal places. Relative…
A:
Q: An environmental organization releases an annual beach report card based on water quality. The…
A: The grades for 20 beaches in three counties in a certain state during dry weather are given below. B…
Q: Calculate the mean of the grouped data from the given frequency distribution. Round your answer to…
A:
Q: The following frequency data shows the number of states, Including the District of Columbla, that…
A: Given data, 1976 election 2012 Election Total Democrat Republic Democrat 12 12 24…
Q: For the following frequency distribution table calculate the mean, where the class limit is 4 Class…
A:
Q: Find each value requested for the set of scores in the following frequency distribution tal 4 .3…
A:
Q: Find the mean for the scores in the following frequency distribution table
A: The frequency table with the corresponding frequencies is, Number Frequency Cumulative frequency…
Q: Find the mode for the scores in the following frequency distribution table: Number Frequency…
A: Note: Considering scores as 16, 15, 13, 12, 11 and the corresponding cumulative frequencies are…
Q: Calculate the mean of the grouped data from the given frequency distribution. Round your answer to…
A: Solution: Class Frequency(f) Midpoint (x) fx 40-49 2 44.5 89 50-59 5 54.5 272.5 60-69…
Q: Given the following frequency distribution, calculate the relative frequency of Red. Color of m&m's…
A:
Q: In a frequency distribution, the class with the greatest frequency is call the class.
A: Frequency distribution.
Q: Among fatal plane crashes that occurred during the past 70 years, 577 were due to pilot error, 86…
A: The following table represents the relative frequency distribution for the given data.
Q: Construct the relative frequency distribution that corresponds to the given frequency distribution.…
A:
Q: Construct the cumulative frequency distribution that corresponds to the given frequency…
A: Given Data, Speed Number of cars 0-29 4 30-59 16 60-89 60 90-119 20 Total 100
Q: Complete the relative frequency distribution below. Relative Cause Frequency Pilot error % Other…
A: Given: Causes Frequency Pilot error 168 Other human error 67 Weather 488 Mechanical…
Q: What is the highest score that anyone achieved in the data shown on the frequency distribution table…
A:
Q: Calculate mean, mode, median from the following frequency table. Class…
A: The table given below helps to find the mean. Class limits Frequency Mid point fx Cf 4-6 4 5 20…
Q: Below is the frequency distribution of personal Computers on by students at a community college.…
A:
Q: In a survey of 35 families in a village, the number of children per family was recorded and the…
A: Given Data 1,0,2,3,4,5,6,7,2,3,4,0,2,5,8,4,5,12,6,3,2,7,6,5,3,3,7,8,9,7,9,4,5,4,3 We want to make…
Q: Set up the following scores into a grouped frequency distribution. Obtain relative frequency and…
A:
Q: Data was collected for 185 fish from the North Atlantic. The length of the fish (in cm) is…
A: Given: The given diagram is:
Q: Use the frequency distribution on driver age to answer the questions. Age Frequency 16 - 23 9 24 -…
A: The number of values corresponding to a class or observation is defined as the frequency of that…
Q: Data was collected for 225 fish from the North Atlantic. The length of the fish (in cm) is…
A: The histogram of length of 225 fishes are given.
Q: The following data give the total number of iPods sold by a mail order company on each of 30 days.…
A: From the given information, Minimum value=5 Maximum value=29 Consider, the number of classes is 8…
Q: Consider the following frequency distribution.Class Frequency10–19 1020–29 1430–39 1740–49 750–59…
A: Frequency distribution is given as follows. Class Frequency10–19 1020–29 1430–39 1740–49 750–59 2
Q: Among fatal plane crashes that occurred during the past 50 years, 481 were due to pilot error, 99…
A: The number of values corresponding to a class or observation is defined as the frequency of that…
Q: for the following frequency distribution, how many individual scores are in the entire set? n=54,…
A: Given that,


Trending now
This is a popular solution!

Step by step
Solved in 2 steps


- The distribution of the arrival times of students coming to Chemistry class late is not normally distributed. A sample of 33 students is taken, with mean, μ=3.2 and standard deviation, σ=8.4. Is Central Limit Theorem applicable in the following cases? Explain why.The National Vaccine Information Center estimates that 90% of Americans have had chickenpox by the time they reach adulthood. Suppose we take a random sample of 100 American adults. Use the Central Limit Theorem to compute the standard error for the sampling distribution. Write you answer as a decimal rounded to three places.Use the central limit theorem to find the mean and standard error of the mean of the indicated sampling distribution. Then sketch a graph of the sampling distribution. The per capita consumption of red meat by people in a country in a recent year was normally distributed, with a mean of 113 pounds and a standard deviation of 37.7 pounds. Random samples of size 20 are drawn from this population and the mean of each sample is determined.
- Use the central limit theorem to find the mean and standard error of the mean of the indicated sampling distribution. Then sketch a graph of the sampling distribution. The per capita consumption of red meat by people in a country in a recent year was normally distributed, with a mean of 106 pounds and a standard deviation of 38.6 pounds. Random samples of size 17 are drawn from this population and the mean of each sample is determined. Ux = Standard deviation =Let X be the time between successive arrivals to an intersection in a rural area. Suppose cars arrive to the intersection via a Poisson process at a rate of 1 every 5 minutes. (a) What distribution does X have? (b) What is the mean time between arrivals? (c) What is the probability that more than 7 minutes will pass between arrivals to the inter-section?The total cholesterol levels for women aged 20 to 30 years are normally distributed with µ=190 mg/dl and σ=40 mg/dl. A sample of 25 women in this age-group is randomly selected. What range of cholesterol series is expected for the middle 99% of all sample means?
- Use the central limit theorem to find the mean and standard error of the mean of the indicated sampling distribution. Then sketch a graph of the sampling distribution. The per capita consumption of red meat by people in a country in a recent year was normally distributed, with a mean of 116 pounds and a standard deviation of 38.3. pounds. Random samples of size 20 are drawn from this population and the mean of each sample is determined. μx=____Inclusions are defects in poured metal caused by contaminants. The number of (large) inclusions in cast iron follows a Poisson distribution with a rate of 3.4 per cubic millimetre. What is the probability of at least one inclusion in a cubic millimetre? Please enter the answer to 3 decimal places.Inclusions are defects in poured metal caused by contaminants. The number of (large) inclusions in cast iron follows a Poisson distribution with a rate of 1.9 per cubic millimetre. What is the volume of material to inspect such that the probability of at least one inclusion is 0.99? Please enter the answer to 2 decimal places.
- Define the homoskedasticity-only F-statistic when n is small?What is the Central Limit Theorem? It is always true that as the sample size, n, increases, the distribution of the sample means will be approximately normally distributed. ExplainA researcher in an alcoholism treatment center, interested in summarizing the length of stay in the center for first-time patients, randomly selects nine records of individuals institutionalized within the previous two years. The lengths of stay in the center, in days, are as follows 11, 7, 20, 9, 13, 4, 13, 14, and 8. a.What are the measures of central tendency for this distribution? (Show calculations) b.Show two measures of variation for this distribution? (Show calculations)