Find the missing value in the following frequency distribution table. Cumulative Class Frequency Frequency Percent 15 - 19 12.500% 20 - 24 7 30.000% 25 - 29 6. 45.000% 30 34 15 35 - 39 90.000% 40 44 4 100.000% Do not round your answer. X =
Find the missing value in the following frequency distribution table. Cumulative Class Frequency Frequency Percent 15 - 19 12.500% 20 - 24 7 30.000% 25 - 29 6. 45.000% 30 34 15 35 - 39 90.000% 40 44 4 100.000% Do not round your answer. X =

Glencoe Algebra 1, Student Edition, 9780079039897, 0079039898, 2018
18th Edition
ISBN:9780079039897
Author:Carter
Publisher:Carter
Chapter10: Statistics
Section10.6: Summarizing Categorical Data
Problem 4DGP

Related questions
Question
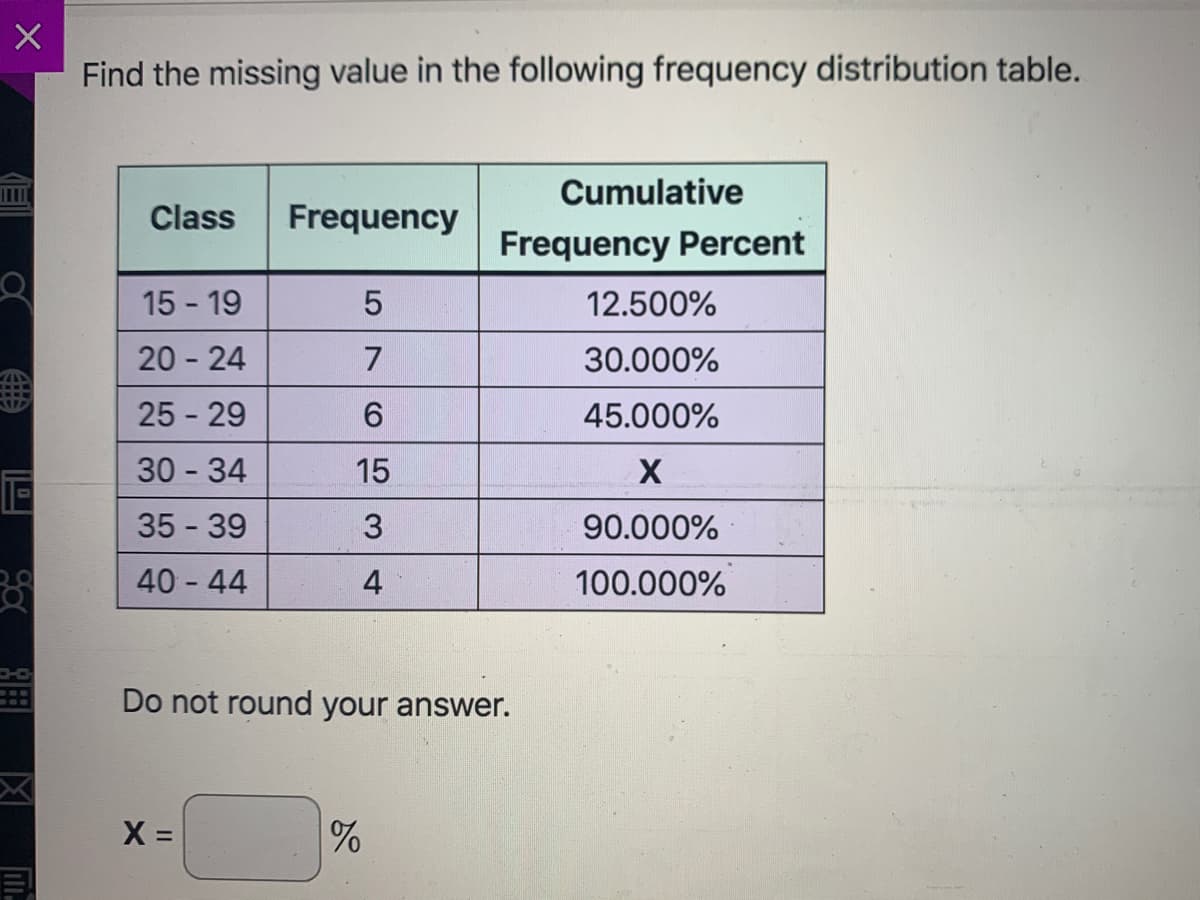
Transcribed Image Text:Find the missing value in the following frequency distribution table.
Cumulative
Class
Frequency
Frequency
Percent
15 - 19
12.500%
20 - 24
7
30.000%
25 - 29
6.
45.000%
30 34
15
35 - 39
3
90.000%
40 44
4
100.000%
Do not round your answer.
X =
%
Expert Solution
This question has been solved!
Explore an expertly crafted, step-by-step solution for a thorough understanding of key concepts.

This is a popular solution!

Trending now
This is a popular solution!

Step by step
Solved in 2 steps with 2 images

Recommended textbooks for you
Glencoe Algebra 1, Student Edition, 9780079039897…
Algebra
ISBN:
9780079039897
Author:
Carter
Publisher:
McGraw Hill
Glencoe Algebra 1, Student Edition, 9780079039897…
Algebra
ISBN:
9780079039897
Author:
Carter
Publisher:
McGraw Hill