Find the value of A, B and C. (b) Show that the value for the degree of freedom (df) is 2. (c) State the appropriate hypotheses to test whether the types of services are independent of the tourists' opinion. (d) Based on the p-value, what can you conclude about the investigation? Use α = 0.05

Holt Mcdougal Larson Pre-algebra: Student Edition 2012
1st Edition
ISBN:9780547587776
Author:HOLT MCDOUGAL
Publisher:HOLT MCDOUGAL
Chapter11: Data Analysis And Probability
Section11.5: Interpreting Data
Problem 1C
icon
Related questions
Topic Video
Question

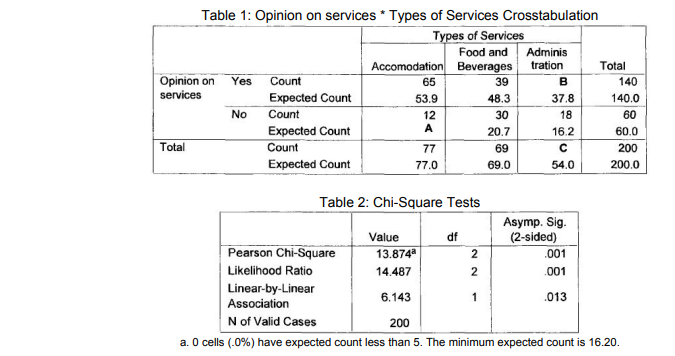
A study was conducted to investigate whether the types of services provided at a hotel complies with the guidelines that have been established by the Ministry of Tourism Malaysia. A group of researchers distributed questionnaires to gather information regarding the types of services offered by the hotel and the opinion of the tourist whether the hotel complies with the guidelines. The data were analyzed using SPSS and the outputs are given in tables 1 and 2


(a) Find the value of A, B and C.
(b) Show that the value for the degree of freedom (df) is 2.
(c) State the appropriate hypotheses to test whether the types of services are independent of the
tourists' opinion.
(d) Based on the p-value, what can you conclude about the investigation? Use α = 0.05

Table 1: Opinion on services * Types of Services Crosstabulation
Types of Services
Food and Adminis
tration
Accomodation Beverages
Total
Opinion on
services
Yes
Count
65
39
B
140
Expected Count
Count
53.9
48.3
37.8
140.0
No
12
30
18
60
A
Expected Count
Count
20.7
16.2
60.0
Total
77
69
200
Expected Count
77.0
69.0
54.0
200.0
Table 2: Chi-Square Tests
Asymp. Sig.
(2-sided)
.001
Value
df
Pearson Chi-Square
13.874
2
Likelihood Ratio
14.487
2
.001
Linear-by-Linear
Association
6.143
1
.013
N of Valid Cases
200
a. O cells (.0%) have expected count less than 5. The minimum expected count is 16.20.
Transcribed Image Text:Table 1: Opinion on services * Types of Services Crosstabulation Types of Services Food and Adminis tration Accomodation Beverages Total Opinion on services Yes Count 65 39 B 140 Expected Count Count 53.9 48.3 37.8 140.0 No 12 30 18 60 A Expected Count Count 20.7 16.2 60.0 Total 77 69 200 Expected Count 77.0 69.0 54.0 200.0 Table 2: Chi-Square Tests Asymp. Sig. (2-sided) .001 Value df Pearson Chi-Square 13.874 2 Likelihood Ratio 14.487 2 .001 Linear-by-Linear Association 6.143 1 .013 N of Valid Cases 200 a. O cells (.0%) have expected count less than 5. The minimum expected count is 16.20.
Expert Solution
steps

Step by step

Solved in 3 steps

Blurred answer
Knowledge Booster
Hypothesis Tests and Confidence Intervals for Means
Learn more about
Need a deep-dive on the concept behind this application? Look no further. Learn more about this topic, statistics and related others by exploring similar questions and additional content below.
Similar questions
Recommended textbooks for you
Holt Mcdougal Larson Pre-algebra: Student Edition…
Algebra
ISBN:
9780547587776
Author:
HOLT MCDOUGAL
Publisher:
HOLT MCDOUGAL
Glencoe Algebra 1, Student Edition, 9780079039897…
Algebra
ISBN:
9780079039897
Author:
Carter
Publisher:
McGraw Hill
College Algebra
College Algebra
Algebra
ISBN:
9781938168383
Author:
Jay Abramson
Publisher:
OpenStax