A manufacturing company designed a factorial experiment to determine whether the number of defective parts produced by two machines differed and if the number of defective parts produced also depended on whether the raw material needed by each machine was loaded manually or by an automatic feed system. The following data give the numbers of defective parts produced. Loading System Manual Automatic 31 31 Machine 1 35 25 20 25 Machine 2 23 29 Use a = 0.05 to test for any significant effect due to machine, loading system, and interaction. Set up the ANOVA table. Assume that Factor A is Machine and Factor B is Loading System. If your answer is zero, enter "0". Source Sum of Squares Degrees Mean Square p-value of Variation (to 2 decimals) of Freedom (to 2 decimals) (to 2 decimals) (to 2 decimals) Factor A Factor B Interaction Error Total The p-value for Factor A is - Select your answer - What is your conclusion with respect to Factor A? - Select your answer - The p-value for Factor B is Select your answer - What is your conclusion with respect to Factor B? - Select your answer -
A manufacturing company designed a factorial experiment to determine whether the number of defective parts produced by two machines differed and if the number of defective parts produced also depended on whether the raw material needed by each machine was loaded manually or by an automatic feed system. The following data give the numbers of defective parts produced. Loading System Manual Automatic 31 31 Machine 1 35 25 20 25 Machine 2 23 29 Use a = 0.05 to test for any significant effect due to machine, loading system, and interaction. Set up the ANOVA table. Assume that Factor A is Machine and Factor B is Loading System. If your answer is zero, enter "0". Source Sum of Squares Degrees Mean Square p-value of Variation (to 2 decimals) of Freedom (to 2 decimals) (to 2 decimals) (to 2 decimals) Factor A Factor B Interaction Error Total The p-value for Factor A is - Select your answer - What is your conclusion with respect to Factor A? - Select your answer - The p-value for Factor B is Select your answer - What is your conclusion with respect to Factor B? - Select your answer -

Glencoe Algebra 1, Student Edition, 9780079039897, 0079039898, 2018
18th Edition
ISBN:9780079039897
Author:Carter
Publisher:Carter
Chapter10: Statistics
Section10.6: Summarizing Categorical Data
Problem 10CYU

Related questions

Topic Video
Question
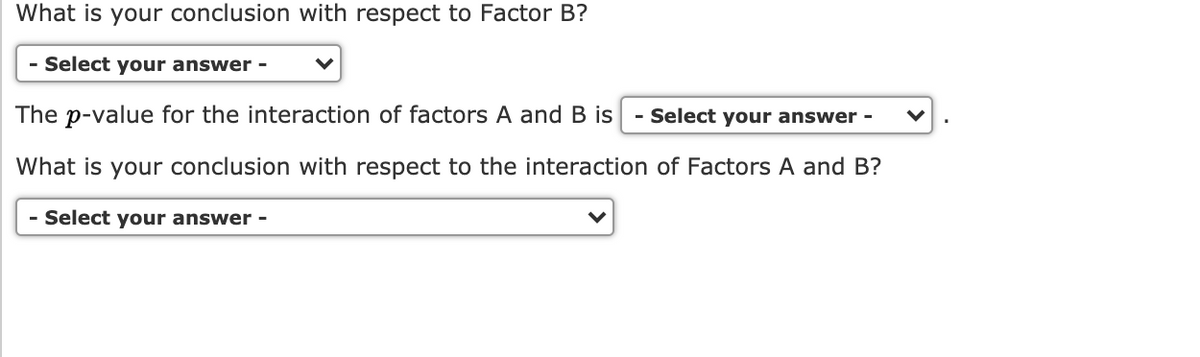
Transcribed Image Text:What is your conclusion with respect to Factor B?
- Select your answer -
The p-value for the interaction of factors A and B is
Select your answer -
What is your conclusion with respect to the interaction of Factors A and B?
- Select your answer -
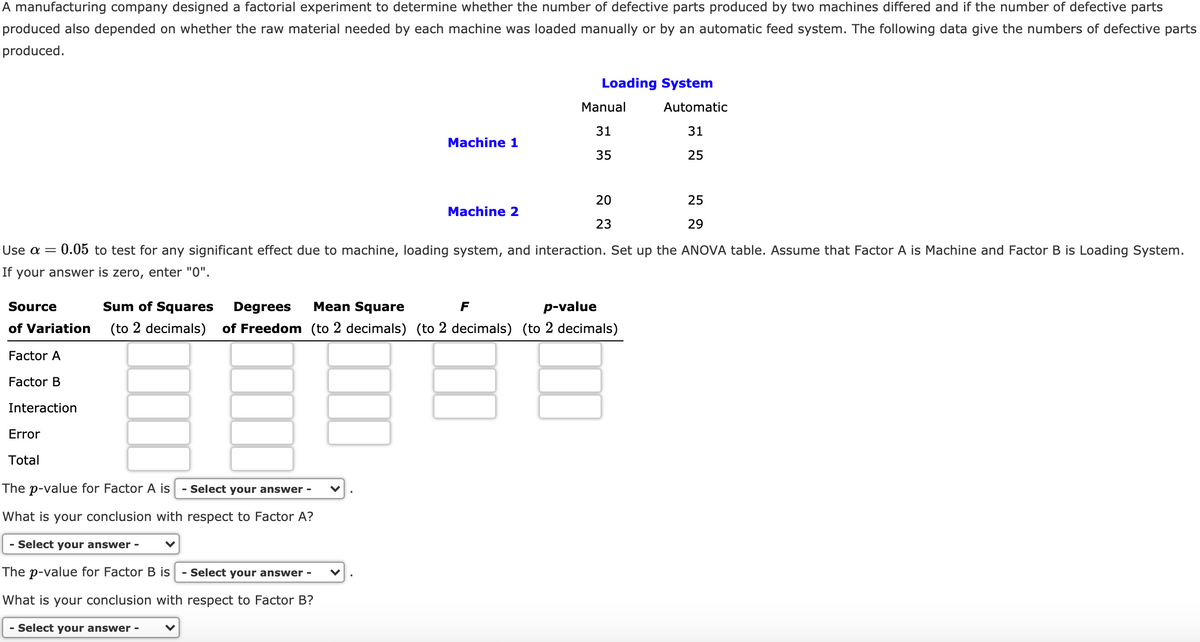
Transcribed Image Text:A manufacturing company designed a factorial experiment to determine whether the number of defective parts produced by two machines differed and if the number of defective parts
produced also depended on whether the raw material needed by each machine was loaded manually or by an automatic feed system. The following data give the numbers of defective parts
produced.
Loading System
Manual
Automatic
31
31
Machine 1
35
25
20
25
Machine 2
23
29
Use a =
0.05 to test for any significant effect due to machine, loading system, and interaction. Set up the ANOVA table. Assume that Factor A is Machine and Factor B is Loading System.
If
your answer is zero, enter "0".
Source
Sum of Squares
Degrees
Mean Square
F
p-value
of Variation
(to 2 decimals)
of Freedom (to 2 decimals) (to 2 decimals) (to 2 decimals)
Factor A
Factor B
Interaction
Error
Total
The p-value for Factor A is
- Select your answer -
What is your conclusion with respect to Factor A?
- Select your answer -
The p-value for Factor B is
- Select your answer -
What is your conclusion with respect to Factor B?
- Select your answer -
Expert Solution
This question has been solved!
Explore an expertly crafted, step-by-step solution for a thorough understanding of key concepts.

This is a popular solution!

Trending now
This is a popular solution!

Step by step
Solved in 4 steps with 13 images

Knowledge Booster


Learn more about
Need a deep-dive on the concept behind this application? Look no further. Learn more about this topic, statistics and related others by exploring similar questions and additional content below.Recommended textbooks for you
Glencoe Algebra 1, Student Edition, 9780079039897…
Algebra
ISBN:
9780079039897
Author:
Carter
Publisher:
McGraw Hill

Holt Mcdougal Larson Pre-algebra: Student Edition…
Algebra
ISBN:
9780547587776
Author:
HOLT MCDOUGAL
Publisher:
HOLT MCDOUGAL
Glencoe Algebra 1, Student Edition, 9780079039897…
Algebra
ISBN:
9780079039897
Author:
Carter
Publisher:
McGraw Hill
Holt Mcdougal Larson Pre-algebra: Student Edition…
Algebra
ISBN:
9780547587776
Author:
HOLT MCDOUGAL
Publisher:
HOLT MCDOUGAL