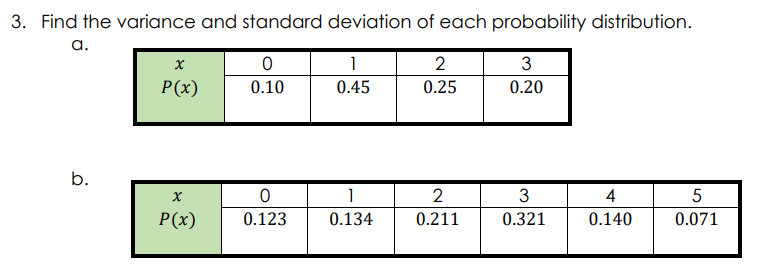
Find the variance and standard deviation of each probability distribution. a. 2 3 P(x) 0.10 0.45 0.25 0.20 b. 2 3 4 5 P(x) 0.123 0.134 0.211 0.321 0.140 0.071
Q: A market research firm supplies manufacturers with estimates of the retail sales of their products…
A: 1. a) Denote μ1, μ2 as the population mean sales for this year and last year, respectively.
Q: A researcher daims that a post-lunch nap decreases the amount of time it takes males to sprint 20…
A: Given The data is as follows: Male Sprint time (without nap) Sprint time (with nap) 1 4.01 3.89…
Q: a) A manufacturer of apple phone charges claims that only 4% of his production is defective. In a…
A: Given, Sample size = n = 120 Sample proportion = p^ = 4.99% = 0.0499 Claim : A manufacturer of apple…
Q: A private university has just introduced a new e-learning programme. The university randomly…
A: a. Null Hypothesis: H0: The e-learning programme is not effective. Alternative Hypothesis: H1: The…
Q: (wolio! Jlgw) For the following data set {14.2, 126.9, 52.0, 8.5, 31.3, 14.6, 38.4, 71.0}, if…
A: For the following data set (14.2, 126.9, 52.0, 8.5, 31.3, 14.6, 38.4, 71.0}, if log8= 0.9031, We…
Q: pls answer D thank u
A: Given The population has following elements: 6, 9, 12, 15, 18 and 21 Samples of size 5 are to be…
Q: Drill lifetime: A sample of 50 drills had a mean lifetime of 12.46 holes drilled when drilling a…
A: For the given data Find 95 % C.I
Q: Given in the table are the BMI statistics for random samples of men and women. Assume that the two…
A:
Q: 3. A delivery truck travels from point A to point B and back using the same route each day. There…
A: Hey there! Thank you for posting the question. Since your question has more than 3 parts, we are…
Q: In marketing children’s products, it is extremely important to produce television commercials that…
A: Excel Procedure: Enter the data for Toys, Food, Children's clothing in Excel sheet. Go to Data…
Q: Test the claim about the difference between two population means 4 and 2 at the level of…
A:
Q: A researcher wishes to try three different techniques to lower the blood pressure of individuals…
A: For the given data Perform Anova: Single Factor
Q: Roll 1 100.6:15= Roll 2 Roll 3 Roll 4 Roll S Average Your Mean of Averages: 7.10 1.2 6.6 1.8 7. 6.4…
A: Given Information: Theoretical population parameters: Population mean μ=7 Population standard…
Q: If two variables, x and y, have a very strong linear relationship, then: There might not be any…
A: An interpretation is to be inferred from the specified nature of the relationship between the…
Q: You inay need t e the ppropriate tecnology to enswer this qestion completery randomad design the…
A: There are 3 independent samples which are 3 treatments. We have to find the sum of squares and mean…
Q: used car dealer says that the mean price of a three-year-old sports utility vehicle is $22,000.…
A: Given
Q: A teacher has two large containers filled with blue, red, and green beads, and claims the proportion…
A: Assume that p1 and p2 are the true proportion of red beads in container 1 and 2, respectively.
Q: Week Labour, (hr) Pounds Shipped (1,000s) Percentage of Units Shipped by Truck Average Shipment…
A: There are 3 independent variables and 1 dependent variable. We have to find the total sum of squares…
Q: Determine the point estimate, p and the sample standard deviation, S5.
A: here n = 439 x= 162 here x= no of students working full time while going to school
Q: Below is some of the regression output from a simple regression of the number of wins for a major…
A: The independent variable is Payroll. The dependent variable is Wins. We have to fill the missing…
Q: What is the probability of drawing 2 red balls and then 3 blue balls from an urn containing 6 red…
A:
Q: Test the claim that the two samples described below come from populations with the same mean. Assume…
A:
Q: survey was done in regards to what type of animals are preferred as pets. Each respondent selected…
A: From the given information we find the probability.
Q: a). What is the point estimate of the true proportion of passengers who prefer aisle seats? b).…
A: Here use interval estimate of population proportion
Q: 80. The standard deviation of the population is known to be $66. Assume that the population is…
A:
Q: (c)P(-k <T <k) = 0.90
A: Given that C) Sample size=n=24 P( -k<T<k)=0.90
Q: Say you roll two dice. Find the probability c rolling a number greater than 2 on the first, and then…
A:
Q: A rowing team consists of five rowers who weigh 152, 159, 162, 150 and 156 pounds. Find all possible…
A: Given: Weights of five rowers- 152,159,162,150,156 Sample size, n=3
Q: Are blonde female college students just as likely to have boyfriends as brunette female college…
A: Assume that p1 and p2 are the true population proportions of blonde and brunette female college…
Q: j. In the presence of autocorrelation, ordinary lease squares (OLS) produce unbiased estimates and…
A: Please find the solution below. Thank you
Q: AV I L uL ITL u HALAS JU LULMLIN\ For a random sample of 60 overweight men, the mean of the number…
A:
Q: What is there to learn from this visual representatio
A: From the given graphs, The graphs represents that the desirability scores of the employees and…
Q: ading proficiency: An educator wants to construct a 90% confidence interval for the proportion of…
A:
Q: 4 2. 4. 2. 3. 3. 2.
A: The data is shown below x y 2 5 3 2 3 4 2 4 2 3 4 1 3 4 2 2
Q: What is conditional Probability?
A: We have to define conditional probability.
Q: Consider the population described by the probability distribution shown in the table. The random…
A:
Q: (a) Give the marginal density of X1. (b) Give the marginal density of X2. (c) Give the conditional…
A:
Q: The table below shows the scores for two subjects (history and geography) obtained by a group of…
A: Here, the given table shows the scores for history and geography. The sample size n is 15. Score…
Q: Find the mean, variance, and standard deviation for the number of sixes that appear when rolling 40…
A:
Q: How many different ways can 5 out of 8 different shirts, 4 out of 10 different pairs of slacks, and…
A: We have given that 8 different shirts, 10 different pairs of slacks and 6 ties. Combination…
Q: Answer the following problems. 1. Find the values of t for which the area on the right tail of the…
A: Given: 1. Area on the right tail of the distribution is 0.05 2. degrees of freedom (df)=18 3. Sample…
Q: For the following population, calculate Kurtosis coefficient, Frequency histogram, Normal…
A: Given: 156 161 172 162 167 158 163 160 155 160 165 173 152 168 160…
Q: d. The probability that a person will be born between weeks 18 and 39 is P(18 39) = f. P(x > 8 | x<…
A: Note: Hey, since there are multiple subparts are posted, we will answer first three subparts for…
Q: The output below attempts to predict the salary an accountant makes. What is the predicted salary…
A:
Q: If X has probability density function f(x) = ce", 0 < x < 1. %3D Determine Var(X).
A:
Q: The graph of two independent factor levels that intersect with each other indicates that…
A: Consider the graph of two independent factor levels that intersect with each other. We have to…
Q: Regression modeling is a statistical framework for developing a mathematical equation that o One…
A: Regression Modelling is a statistical framework for developing a mathematical equation
Q: Is the proportion of wildfires caused by humans in the south higher than the proportion of wildfires…
A:
Q: Part 1 of 3 (a) Construct a 98% confidence interval for the PCB concentration. Use tables or…
A:
Q: Question 4) Please help with this question. Suppose that on a 100-point test, the teacher's goal is…
A:
Step by step
Solved in 3 steps with 2 images