Find the Z-scores that separate the middle 48% of the distribution from the area in the tails of the standard normal distribution. Tables of Areas under the Normal Curve E Click the icon to view a table of areas under the normal curve. The Z-scores are e. (Use a comma to separate answers as needed. Round to two decimal places as needed.) TABLE V Standard Normal Distribution 00 .01 .02 03 04 .05 06 07 .08 .09 Area 0.0003 0.0001 0.0003 0.0003 0.0003 0.0003 0,000 0.0004 -34 0.0003 0.0003 0.0002 0.0005 0.0005 0.0005 0.0004 0.0004 0.0004 0.0004 0.0004 0.0007 0.0007 0.0006 0006 0.0003 0.0005 00005 -32 0.0006 0.0006 0.0006 0.0005 0.0010 009 0.0013 0013 0013 0012 0.0008 0.0011 0.0011 -31 0.0009 0.0009 0.0008 0008 Z1000 0.0012 0.0016 0016 0.0015 0015 0.0023 0.0022 0.0021 0.000 0.0007 0.0007 -30 0.0011 0.0010 0.0010 0.0019 0018 0.0018 0.0017 -29 -28 0026 0.0025 0.0024 0.0023 0.0021 0.0014 0014 0.0020 0.0019 0.0027 0026 -27 0.0035 0.0034 0.0033 0.0032 0.0031 0.0030 0.0029 0028 -26 0.0047 00045 0.0044 0.0043 0041 0.0040 0.0039 0038 0.0037 0036 -25 0.0062 0.0060 0.0099 0.057 0.0055 0.0054 0.0052 0.0051 0.0049 0.0048 -24 -23 0.0082 0.0080 0.0078 0.0075 0.0073 0.0071 0.0069 0.0068 0.0064 1800'0 0.0084 0.0066 00107 0.0104 0.0102 0.0099 0.0089 00139 0.0136 0.0132 0.0129 0.0125 0.0122 00119 0.0116 0.0113 00179 00174 00228 0022 0.0096 0094 0.0091 -22 0.0110 -21 -20 0.0170 0.0166 0.0217 0.0212 0.0162 00158 00154 0.0207 0.0192 0.018 0.0202 00197 00150 0.0146 0.0143 0.0183 0.0287 0.0281 00359 0.0274 0.028 0.0344 0.0336 0.0329 0.0322 0.0314 0.0062 00256 0.0250 0.0244 0.0239 0.0233 0.0307 0.0301 0.0294 -19 -L8 -17 -16 0.0351 00446 0016 00548 0.0537 0,0418 00409 00401 009 0.0505 0.0495 2 00384 0.0375 0.0367 0O8S 0.0475 0.0465 0.0455 -15 0.0668 0.0655 0.0643 0.0630 0.0618 0.0606 0.0594 0.0582 0.0571 0.0559 -14 -13 0.0778 0.0764 0.0934 0.09I8 0.0749 0.0901 0OS8S Q.0s69 0.OR53 0.0838 0.0808 0.0793 0.0968 -12 a1151 a1131 01357 0.0735 0.0721 0.0694 0.0681 0.0951 0.0985 0.1230 0.1210 0.1190 0.1170 0.1112 0.1093 0.1075 a1056 Q.1038 a.1020 0.1003 -LI 0.1335 0.1314 0.1292 -10 01587 0.1562 0.1539 0.1515 0.1492 01469 Q1446 Q1423 0.1401 0.1379 -0.9 a1841 0.1814 0.1788 0.1762 0.1736 a1711 a1685 a1660 0.2033 02327 0.1635 0.1611 0.1977 a1949 a.1922 0.1894 0.1867 02148 0.1660 -08 02119 0.2090 02420 02389 0.2061 0.2358 0.2005 0.2296 0.2266 0.2236 0.2206 02177 -0.7 -06 02743 02709 0.2676 02643 0.2611 s 0308S 03090 0 2015 0296 02012 07877 0 7841 0781o 02776 02578 02546 02514 02483 0.2451 02981 07843
Find the Z-scores that separate the middle 48% of the distribution from the area in the tails of the standard normal distribution. Tables of Areas under the Normal Curve E Click the icon to view a table of areas under the normal curve. The Z-scores are e. (Use a comma to separate answers as needed. Round to two decimal places as needed.) TABLE V Standard Normal Distribution 00 .01 .02 03 04 .05 06 07 .08 .09 Area 0.0003 0.0001 0.0003 0.0003 0.0003 0.0003 0,000 0.0004 -34 0.0003 0.0003 0.0002 0.0005 0.0005 0.0005 0.0004 0.0004 0.0004 0.0004 0.0004 0.0007 0.0007 0.0006 0006 0.0003 0.0005 00005 -32 0.0006 0.0006 0.0006 0.0005 0.0010 009 0.0013 0013 0013 0012 0.0008 0.0011 0.0011 -31 0.0009 0.0009 0.0008 0008 Z1000 0.0012 0.0016 0016 0.0015 0015 0.0023 0.0022 0.0021 0.000 0.0007 0.0007 -30 0.0011 0.0010 0.0010 0.0019 0018 0.0018 0.0017 -29 -28 0026 0.0025 0.0024 0.0023 0.0021 0.0014 0014 0.0020 0.0019 0.0027 0026 -27 0.0035 0.0034 0.0033 0.0032 0.0031 0.0030 0.0029 0028 -26 0.0047 00045 0.0044 0.0043 0041 0.0040 0.0039 0038 0.0037 0036 -25 0.0062 0.0060 0.0099 0.057 0.0055 0.0054 0.0052 0.0051 0.0049 0.0048 -24 -23 0.0082 0.0080 0.0078 0.0075 0.0073 0.0071 0.0069 0.0068 0.0064 1800'0 0.0084 0.0066 00107 0.0104 0.0102 0.0099 0.0089 00139 0.0136 0.0132 0.0129 0.0125 0.0122 00119 0.0116 0.0113 00179 00174 00228 0022 0.0096 0094 0.0091 -22 0.0110 -21 -20 0.0170 0.0166 0.0217 0.0212 0.0162 00158 00154 0.0207 0.0192 0.018 0.0202 00197 00150 0.0146 0.0143 0.0183 0.0287 0.0281 00359 0.0274 0.028 0.0344 0.0336 0.0329 0.0322 0.0314 0.0062 00256 0.0250 0.0244 0.0239 0.0233 0.0307 0.0301 0.0294 -19 -L8 -17 -16 0.0351 00446 0016 00548 0.0537 0,0418 00409 00401 009 0.0505 0.0495 2 00384 0.0375 0.0367 0O8S 0.0475 0.0465 0.0455 -15 0.0668 0.0655 0.0643 0.0630 0.0618 0.0606 0.0594 0.0582 0.0571 0.0559 -14 -13 0.0778 0.0764 0.0934 0.09I8 0.0749 0.0901 0OS8S Q.0s69 0.OR53 0.0838 0.0808 0.0793 0.0968 -12 a1151 a1131 01357 0.0735 0.0721 0.0694 0.0681 0.0951 0.0985 0.1230 0.1210 0.1190 0.1170 0.1112 0.1093 0.1075 a1056 Q.1038 a.1020 0.1003 -LI 0.1335 0.1314 0.1292 -10 01587 0.1562 0.1539 0.1515 0.1492 01469 Q1446 Q1423 0.1401 0.1379 -0.9 a1841 0.1814 0.1788 0.1762 0.1736 a1711 a1685 a1660 0.2033 02327 0.1635 0.1611 0.1977 a1949 a.1922 0.1894 0.1867 02148 0.1660 -08 02119 0.2090 02420 02389 0.2061 0.2358 0.2005 0.2296 0.2266 0.2236 0.2206 02177 -0.7 -06 02743 02709 0.2676 02643 0.2611 s 0308S 03090 0 2015 0296 02012 07877 0 7841 0781o 02776 02578 02546 02514 02483 0.2451 02981 07843

Glencoe Algebra 1, Student Edition, 9780079039897, 0079039898, 2018
18th Edition
ISBN:9780079039897
Author:Carter
Publisher:Carter
Chapter10: Statistics
Section10.4: Distributions Of Data
Problem 19PFA

Related questions
Question
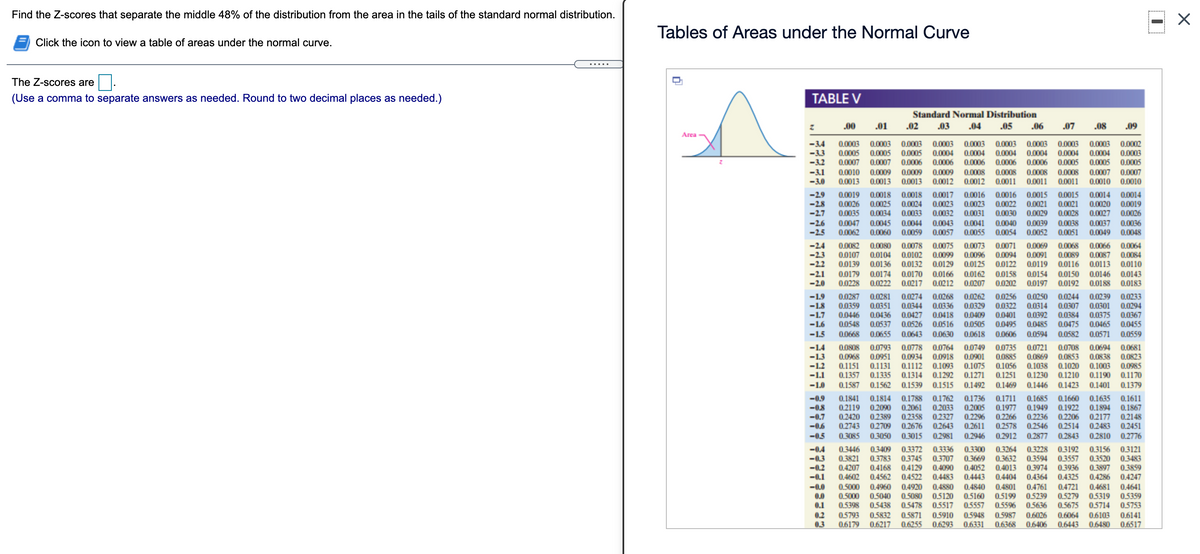
Transcribed Image Text:Find the Z-scores that separate the middle 48% of the distribution from the area in the tails of the standard normal distribution.
Tables of Areas under the Normal Curve
Click the icon to view a table of areas under the normal curve.
.....
The Z-scores are
(Use a comma to separate answers as needed. Round to two decimal places as needed.)
TABLE V
Standard Normal Distribution
.00
.01
.02
.03
.04
.05
.06
.07
.08
.09
Area
-3.4
-3.3
-3.2
0.0003
0.0003
0.0003 0.0003
0.0003
0,0003
0.0004
0.0005
0.0003 0.0003
0.0003
0.0002
0.0003
0.0005
0,0005
0.0005
0.0007
0.0005
0.0004
0.0004 0.0004 0.0004 0.0004
0.0006
0,0009
0.0013
0.0006
0.0008
0.0012
0.0007
0.0006
0.0006 0.0006
0.0005
-3.1
-3.0
0.0007
0.0010
0.0010
0.0009
0.0009
0.0012
0.0007
0.0010
0.0008 0.0008
0.0008
0.0013
0.0013
0.0011
0.0011
0.0011
-2.9
-2.8
-2.7
-2.6
-2.5
0.0019
0.0026
0,0035
0.0016
0.0023
0.0031
0.0015
0.0021
0.0018
0.0018
0,0014
0.0017
0.0023
0.0032
0.0043
0.0016 0.0015
0.0024
0.0033
0.0014
0.0020
0.0027
0.0025
0.0022 0.0021
0.0019
0.0026
0.0034
0.0030 0.0029
0.0028
0.0041
0.0055
0.0037
0.0049
0.0036
0.0048
0.0047
0.0045
0.0060
0.0044
0.0040 0.0039
0.0038
0.0062
0.0059
0.0057
0.0054 0.0052
0.0051
-2.4
-2.3
-2.2
0,0082
0.0107
0.0139
0.0179
0.0228
0.0080
0.0078
0.0075
0.0073
0.0071
0.0069
0.0064
0.0068
0.0089
0.0116
0.0066
0.0102
0.0132
0.0104
0.0099
0.0096
0.0087
0,0094
0.0091
0.0122 0.0119
0.0084
0.0136
0.0129
0.0125
0.0113
0.0110
-2.1
-2.0
0.0174
0.0222
0.0158 0.0154
0.0202 0.0197
0.0143
0.0183
0.0166
0.0162
0.0150
0.0192
0.0170
0.0146
0.0217 0.0212
0.0207
0.0188
0.0281
0.0351
-1.9
-1.8
-1.7
-1.6
0.0287
0.0359
0.0274 0.0268
0.0336
0.0262
0.0329
0.0256
0.0322
0.0250
0.0314
0.0392
0.0239
0.0301
0.0233
0.0294
0.0244
0.0344
0.0427
0.0418
0.0526 0.0516
0.0307
0.0436
0.0537
0.0655
0.0367
0.0455
0.0446
0.0401
0.0375
0.0465
0.0571
0.0409
0.0384
0.0548
0.0505
0.0495 0.0485
0.0475
-1.5
0.0668
0.0643
0.0630
0.0618
0.0606 0.0594
0.0582
0.0559
-1.4
-1.3
-1.2
-1.1
0.0793
0.0749
0.0901
0.1131 0.1112 0.1093 0.1075
0.1271
0.0778
0.0764
0.0735 0.0721
0.0869
0.0808
0.0708
0.0853
0.1020
0.0694
0.0681
0.0968
0.1151
0.1357
0.0838
0.1003
0.0951
0.0934 0.0918
0.0885
0.1056 0.1038
0.1251
0.0823
0.0985
0.1170
0.1335
0.1562
0.1314
0.1292
0.1230
0.1210
0.1190
-1.0
0.1587
0.1539
0.1515
0.1492
0.1469 0.1446
0.1423
0.1401
0.1379
0.1814
0.1788 0.1762 0.1736
0.2061
-09
-08
-0.7
-0.6
0.1611
0.1867
0.2148
0.2451
0.1711 0.1685
0.1977 0.1949
0.1635
0.1894
0.2177
0.2483
0.1841
0.2005
0.2358 0.2327 0.2296 0.2266 0.2236
0.2611
0.1660
0.1922
0.2206
0.2119
0.2420
0.2033
0.2090
0.2389
0.2709
0.2643
0.2981
0.2743
0.2676
0.2578 0.2546
0.2514
-0,5
0.3085
0.3050
0.3015
0.2946
0.2912 0.2877
0.2843
0.2810
0.2776
-0.4
-0,3
-0,2
-0.1
-0.0
0.0
0.1
0.3446
0.3821
0.3409
0.3783
0.4168
0.4562
0.3336
0.3707
0.4090
0.3300
0.3669
0.4052
0.4443
0.3372
0.3264
0.3228
0.3192
0.3156
0.3520
0.3897
0.3121
0.3745
0.4129
0.3557
0.3936
0.4325
0.3632 0.3594
0.3974
0.4364
0.4761
0.5239
0.5636
0.3483
0.4207
0.4013
0.3859
0.4522
0.4920
0.5080
0.5478
0.4602
0.4247
0.4483
0.4880
0.5120
0.5517 0.5557
0.4404
0.4286
0.4721
0.5279
0.5675
0.5000
0.4801
0.5199
0.5596
0.4960
0.4840
0.4681
0.5319
0.5714
0.4641
0.5040
0.5438
0.5359
0.5753
0.5000
0.5160
0.5398
0.5793
0.6179
0.5832
0.5871
0.6026
0.5910
0,6293
0.5948
0.6331
0.5987
0.6103
0.2
0.3
0.6064
0.6141
0.6217
0.6255
0.6368
0.6406
0.6443
0.6480
0.6517
Expert Solution
This question has been solved!
Explore an expertly crafted, step-by-step solution for a thorough understanding of key concepts.

This is a popular solution!

Trending now
This is a popular solution!

Step by step
Solved in 2 steps with 2 images

Recommended textbooks for you
Glencoe Algebra 1, Student Edition, 9780079039897…
Algebra
ISBN:
9780079039897
Author:
Carter
Publisher:
McGraw Hill
Glencoe Algebra 1, Student Edition, 9780079039897…
Algebra
ISBN:
9780079039897
Author:
Carter
Publisher:
McGraw Hill