2.35 1.75 0.9599 0.0401 0.4599 2.70 0.9965 0.0035 0.4965 To find the probability of a z-score, position the orange line at the appropriate z-score on the horizontal axis. The areas under the standard nor curve to the left and right of the vertical line are displayed in blue and orange, respectively. (Hint: The standard normal distribution is symmetrical about the mean, the area under the curve to the left (and right) of the mean is 0.5. Th the area that corresponds with Mean to z is computed as Larger Portion (Body or Tail) – 0.5.) Standard Normal Distribution Mean = 0.0 Standard Deviation = 1.0 .5000 5000 -3.00 -2.50 -2.00 -1.50 -1.00 -0.50 0.00 0.50 1.00 1.50 2.00 2.50 3.00 0.000
2.35 1.75 0.9599 0.0401 0.4599 2.70 0.9965 0.0035 0.4965 To find the probability of a z-score, position the orange line at the appropriate z-score on the horizontal axis. The areas under the standard nor curve to the left and right of the vertical line are displayed in blue and orange, respectively. (Hint: The standard normal distribution is symmetrical about the mean, the area under the curve to the left (and right) of the mean is 0.5. Th the area that corresponds with Mean to z is computed as Larger Portion (Body or Tail) – 0.5.) Standard Normal Distribution Mean = 0.0 Standard Deviation = 1.0 .5000 5000 -3.00 -2.50 -2.00 -1.50 -1.00 -0.50 0.00 0.50 1.00 1.50 2.00 2.50 3.00 0.000

College Algebra
7th Edition
ISBN:9781305115545
Author:James Stewart, Lothar Redlin, Saleem Watson
Publisher:James Stewart, Lothar Redlin, Saleem Watson
Chapter9: Counting And Probability
Section9.4: Expected Value
Problem 1E: If a game gives payoffs of $10 and $100 with probabilities 0.9 and 0.1, respectively, then the...

Related questions
Question
Please help with all parts of this question
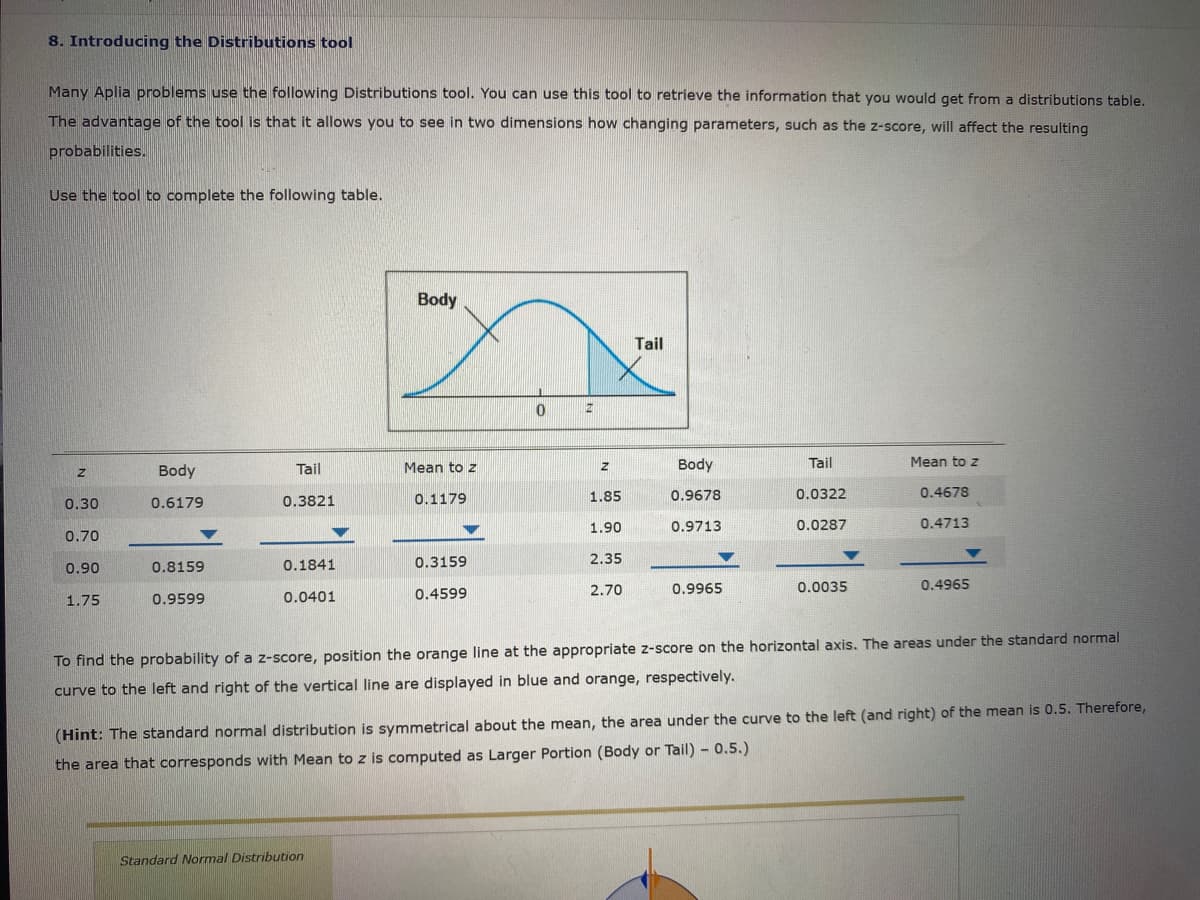
Transcribed Image Text:8. Introducing the Distributions tool
Many Aplia problems use the following Distributions tool. You can use this tool to retrieve the information that you would get from a distributions table.
The advantage of the tool is that it allows you to see in two dimensions how changing parameters, such as the z-score, will affect the resulting
probabilities.
Use the tool to complete the following table.
Body
Tail
Body
Tail
Mean to z
Body
Tail
Mean to z
0.6179
0.3821
0.1179
1.85
0.9678
0.0322
0.4678
0.30
1.90
0.9713
0.0287
0.4713
0.70
0.1841
0.3159
2.35
0.90
0.8159
2.70
0.9965
0.0035
0.4965
1.75
0.9599
0.0401
0.4599
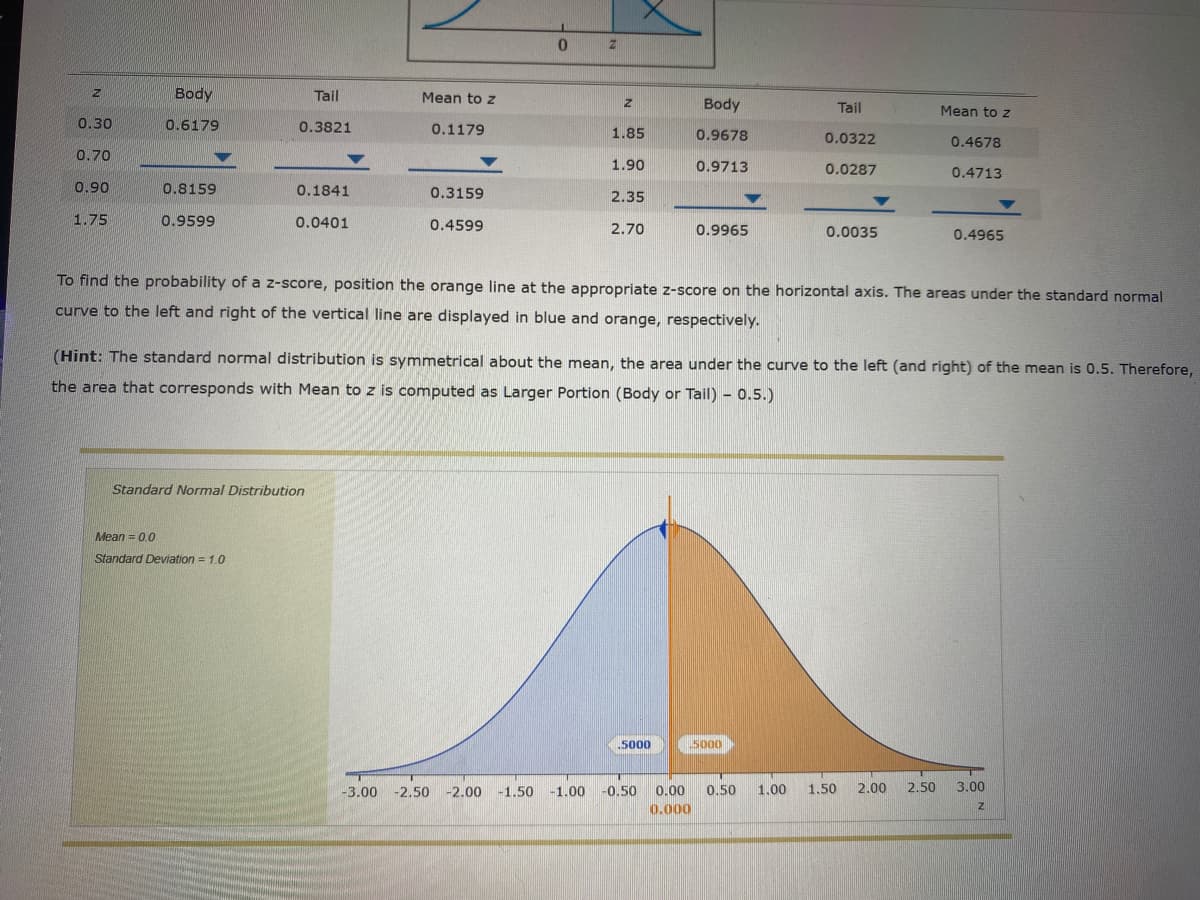
To find the probability of a z-score, position the orange line at the appropriate z-score on the horizontal axis, The areas under the standard normal
curve to the left and right of the vertical line are displayed in blue and orange, respectively.
(Hint: The standard normal distribution is symmetrical about the mean, the area under the curve to the left (and right) of the mean is 0.5. Therefore,
the area that corresponds with Mean to z is computed as Larger Portion (Body or Tail) - 0.5.)
Standard Normal Distribution
Transcribed Image Text:Body
Tail
Mean to z
Body
Tail
Mean to z
0.30
0.6179
0.3821
0.1179
1.85
0.9678
0.0322
0.4678
0,70
1.90
0.9713
0.0287
0.4713
0.90
0.8159
0.1841
0.3159
2.35
1.75
0.9599
0.0401
0.4599
2.70
0.9965
0.0035
0.4965
To find the probability of a z-score, position the orange line at the appropriate z-score on the horizontal axis. The areas under the standard normal
curve to the left and right of the vertical line are displayed in blue and orange, respectively.
(Hint: The standard normal distribution is symmetrical about the mean, the area under the curve to the left (and right) of the mean is 0.5. Therefore,
the area that corresponds with Mean to z is computed as Larger Portion (Body or Tail) – 0.5.)
Standard Normal Distribution
Mean = 0.0
Standard Deviation = 1.0
5000
5000
-3.00
-2.50
-2.00
-1.50
-1.00
-0.50
0.00
0,50
1.00
1.50
2.00
2.50
3.00
0.000
Expert Solution
This question has been solved!
Explore an expertly crafted, step-by-step solution for a thorough understanding of key concepts.

This is a popular solution!

Trending now
This is a popular solution!

Step by step
Solved in 2 steps with 2 images

Recommended textbooks for you
College Algebra
Algebra
ISBN:
9781305115545
Author:
James Stewart, Lothar Redlin, Saleem Watson
Publisher:
Cengage Learning
College Algebra
Algebra
ISBN:
9781305115545
Author:
James Stewart, Lothar Redlin, Saleem Watson
Publisher:
Cengage Learning