Find the P-value. (Round to three decimal places as needed.) Do the data provide sufficient evidence to conclude that the color distribution differs from the reported distribution? A.Yes, because there is sufficient evidence to reject the null hypothesis. B. No,because there is not sufficient evidence to reject the null hypothesis. C.Yes, because there is not sufficient evidence to reject the null hypothesis. D.No, because there is sufficient evidence to reject the null hypothesis
Find the P-value. (Round to three decimal places as needed.) Do the data provide sufficient evidence to conclude that the color distribution differs from the reported distribution? A.Yes, because there is sufficient evidence to reject the null hypothesis. B. No,because there is not sufficient evidence to reject the null hypothesis. C.Yes, because there is not sufficient evidence to reject the null hypothesis. D.No, because there is sufficient evidence to reject the null hypothesis

MATLAB: An Introduction with Applications
6th Edition
ISBN:9781119256830
Author:Amos Gilat
Publisher:Amos Gilat
Chapter1: Starting With Matlab
Section: Chapter Questions
Problem 1P

Related questions
Question
Find the P-value.
(Round to three decimal places as needed.)
Do the data provide sufficient evidence to conclude that the color distribution differs from the reported distribution?
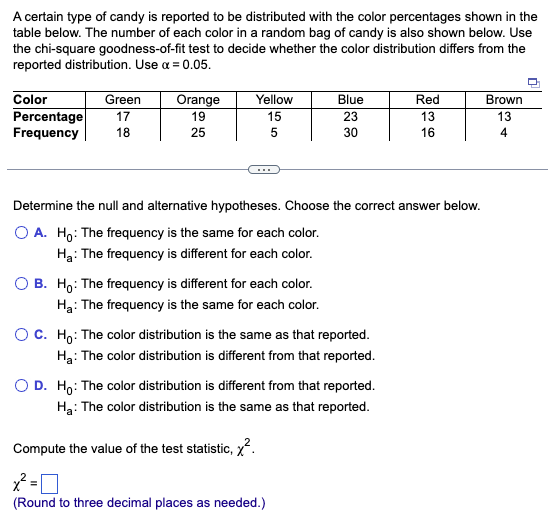
Transcribed Image Text:A certain type of candy is reported to be distributed with the color percentages shown in the
table below. The number of each color in a random bag of candy is also shown below. Use
the chi-square goodness-of-fit test to decide whether the color distribution differs from the
reported distribution. Use α = 0.05.
Color
Percentage
Frequency
Green
17
18
Orange
19
25
Yellow
15
5
Blue
23
30
Determine the null and alternative hypotheses. Choose the correct answer below.
O A. Ho: The frequency is the same for each color.
H₂: The frequency is different for each color.
OB. Ho: The frequency is different for each color.
Ha: The frequency is the same for each color.
O C. Ho: The color distribution is the same as that reported.
H₂: The color distribution is different from that reported.
O D. Ho: The color distribution is different from that reported.
H₂: The color distribution is the same as that reported.
Compute the value of the test statistic, ².
x²=0
(Round to three decimal places as needed.)
Red
13
16
Brown
13
4
Expert Solution
This question has been solved!
Explore an expertly crafted, step-by-step solution for a thorough understanding of key concepts.

Step by step
Solved in 4 steps

Recommended textbooks for you
MATLAB: An Introduction with Applications
Statistics
ISBN:
9781119256830
Author:
Amos Gilat
Publisher:
John Wiley & Sons Inc

Probability and Statistics for Engineering and th…
Statistics
ISBN:
9781305251809
Author:
Jay L. Devore
Publisher:
Cengage Learning

Statistics for The Behavioral Sciences (MindTap C…
Statistics
ISBN:
9781305504912
Author:
Frederick J Gravetter, Larry B. Wallnau
Publisher:
Cengage Learning
MATLAB: An Introduction with Applications
Statistics
ISBN:
9781119256830
Author:
Amos Gilat
Publisher:
John Wiley & Sons Inc
Probability and Statistics for Engineering and th…
Statistics
ISBN:
9781305251809
Author:
Jay L. Devore
Publisher:
Cengage Learning
Statistics for The Behavioral Sciences (MindTap C…
Statistics
ISBN:
9781305504912
Author:
Frederick J Gravetter, Larry B. Wallnau
Publisher:
Cengage Learning

Elementary Statistics: Picturing the World (7th E…
Statistics
ISBN:
9780134683416
Author:
Ron Larson, Betsy Farber
Publisher:
PEARSON

The Basic Practice of Statistics
Statistics
ISBN:
9781319042578
Author:
David S. Moore, William I. Notz, Michael A. Fligner
Publisher:
W. H. Freeman

Introduction to the Practice of Statistics
Statistics
ISBN:
9781319013387
Author:
David S. Moore, George P. McCabe, Bruce A. Craig
Publisher:
W. H. Freeman