The management of a manufacturer of electric motors, submitted the accompanying data in its annual stockholders report. The following table shows the net sales (in millions of dollars) during the 5 years that have elapsed since the new management team took over. Year, x 1 2 3 4 5 Net Sales, y 428 442 455 463 474 (The first year the firm operated under the new management corresponds to the time period x = 1, and the four subsequent years correspond to x = 2, 3, 4, and 5.) (a) Determine the equation of the least-squares line for these data. y = 11.3x + 418.5 V (b) Draw a scatter diagram and the least-squares line for these data. y y 500 500h 480 480 460 460 440 440 420 420 1. 3 4 6 1 2 5 y y 500- 500- 480 480 460 460 440 440 420 420 1 3 4 6. 1. 3 4 5 6 (c) Use the result obtained in part (a) to predict the net sales for the upcoming year.
The management of a manufacturer of electric motors, submitted the accompanying data in its annual stockholders report. The following table shows the net sales (in millions of dollars) during the 5 years that have elapsed since the new management team took over. Year, x 1 2 3 4 5 Net Sales, y 428 442 455 463 474 (The first year the firm operated under the new management corresponds to the time period x = 1, and the four subsequent years correspond to x = 2, 3, 4, and 5.) (a) Determine the equation of the least-squares line for these data. y = 11.3x + 418.5 V (b) Draw a scatter diagram and the least-squares line for these data. y y 500 500h 480 480 460 460 440 440 420 420 1. 3 4 6 1 2 5 y y 500- 500- 480 480 460 460 440 440 420 420 1 3 4 6. 1. 3 4 5 6 (c) Use the result obtained in part (a) to predict the net sales for the upcoming year.

Chapter6: Exponential And Logarithmic Functions
Section6.8: Fitting Exponential Models To Data
Problem 3TI: Table 6 shows the population, in thousands, of harbor seals in the Wadden Sea over the years 1997 to...

Related questions
Topic Video
Question
100%
Hi there,
I just need help with part C of this question.
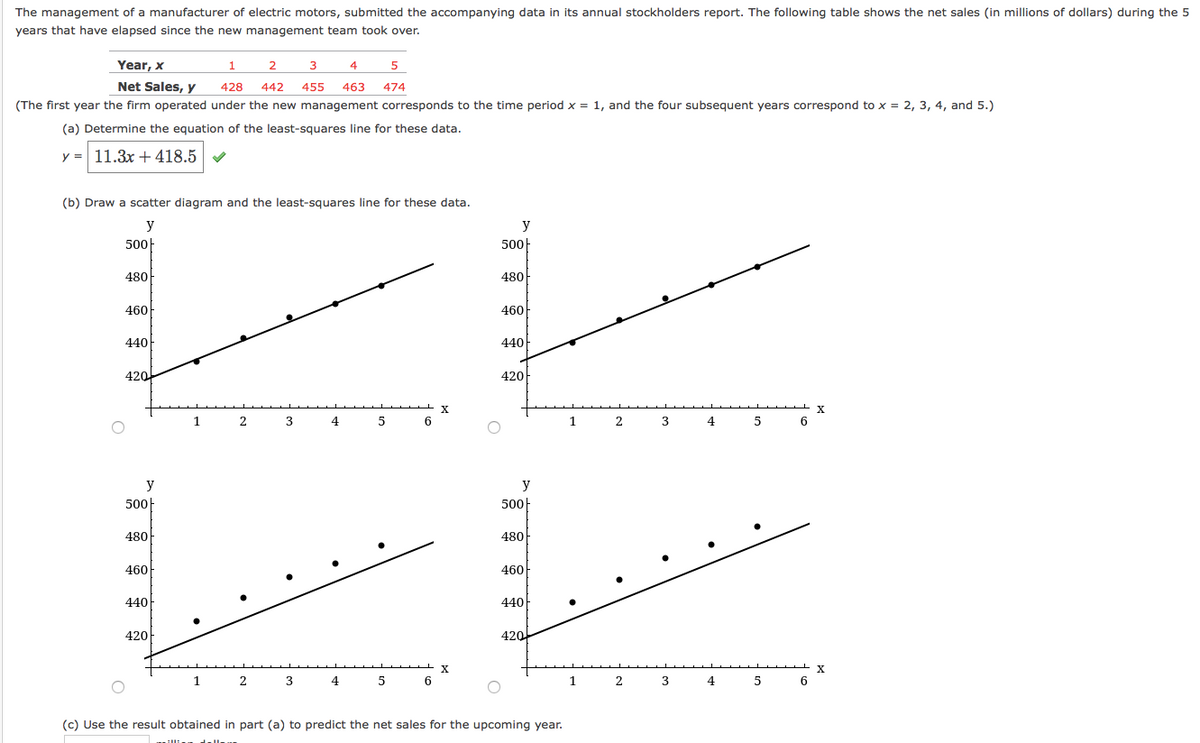
Transcribed Image Text:The management of a manufacturer of electric motors, submitted the accompanying data in its annual stockholders report. The following table shows the net sales (in millions of dollars) during the 5
years that have elapsed since the new management team took over.
Year, x
1
2
3
4
5
Net Sales, y
428
442
455
463
474
(The first year the firm operated under the new management corresponds to the time period x = 1, and the four subsequent years correspond to x = 2, 3, 4, and 5.)
(a) Determine the equation of the least-squares line for these data.
y = 11.3x + 418.5
(b) Draw a scatter diagram and the least-squares line for these data.
y
y
500-
500-
480
480
460-
460
440
440
420
420
2
3
4.
6
3
4
5
y
y
500|
500-
480
480
460
460
440
440
420
420
X
1
3
6
1
2
3
4
(c) Use the result obtained in part (a) to predict the net sales for the upcoming year.
Expert Solution
This question has been solved!
Explore an expertly crafted, step-by-step solution for a thorough understanding of key concepts.

This is a popular solution!

Trending now
This is a popular solution!

Step by step
Solved in 2 steps

Knowledge Booster


Learn more about
Need a deep-dive on the concept behind this application? Look no further. Learn more about this topic, statistics and related others by exploring similar questions and additional content below.Recommended textbooks for you

Algebra & Trigonometry with Analytic Geometry
Algebra
ISBN:
9781133382119
Author:
Swokowski
Publisher:
Cengage

Linear Algebra: A Modern Introduction
Algebra
ISBN:
9781285463247
Author:
David Poole
Publisher:
Cengage Learning
Algebra & Trigonometry with Analytic Geometry
Algebra
ISBN:
9781133382119
Author:
Swokowski
Publisher:
Cengage
Linear Algebra: A Modern Introduction
Algebra
ISBN:
9781285463247
Author:
David Poole
Publisher:
Cengage Learning