Fit a linear regression model relating blood pressure rise in millimeters of mercury (y) to sound pressure level in decibels (x) using least squares. (a) Draw a scatter diagram of y versus x (using statistical software). Does a simple linear regression model seem reasonable in this situation? (b) Calculate the least squares estimate of the slope. B1 = i (Round your answer to 3 decimal places.) (c) Calculate the least squares estimate of the intercept. Bo = i (Round your answer to 3 decimal places.)
Fit a linear regression model relating blood pressure rise in millimeters of mercury (y) to sound pressure level in decibels (x) using least squares. (a) Draw a scatter diagram of y versus x (using statistical software). Does a simple linear regression model seem reasonable in this situation? (b) Calculate the least squares estimate of the slope. B1 = i (Round your answer to 3 decimal places.) (c) Calculate the least squares estimate of the intercept. Bo = i (Round your answer to 3 decimal places.)

Glencoe Algebra 1, Student Edition, 9780079039897, 0079039898, 2018
18th Edition
ISBN:9780079039897
Author:Carter
Publisher:Carter
Chapter10: Statistics
Section10.1: Measures Of Center
Problem 9PPS

Related questions
Question
Show full solution
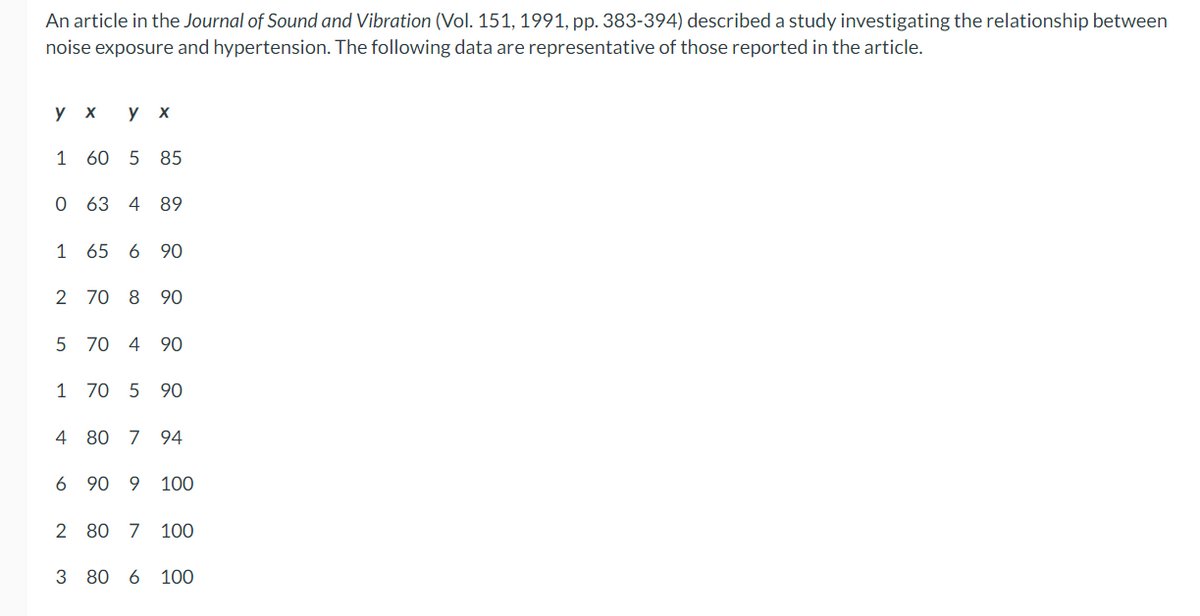
Transcribed Image Text:An article in the Journal of Sound and Vibration (Vol. 151, 1991, pp. 383-394) described a study investigating the relationship between
noise exposure and hypertension. The following data are representative of those reported in the article.
у х
у х
1 60 5 85
0 63 4 89
1
65
6 90
2 70 8 90
5 70 4 90
1 70 5 90
4 80 7 94
6 90 9 100
2 80 7 100
3 80 6 100
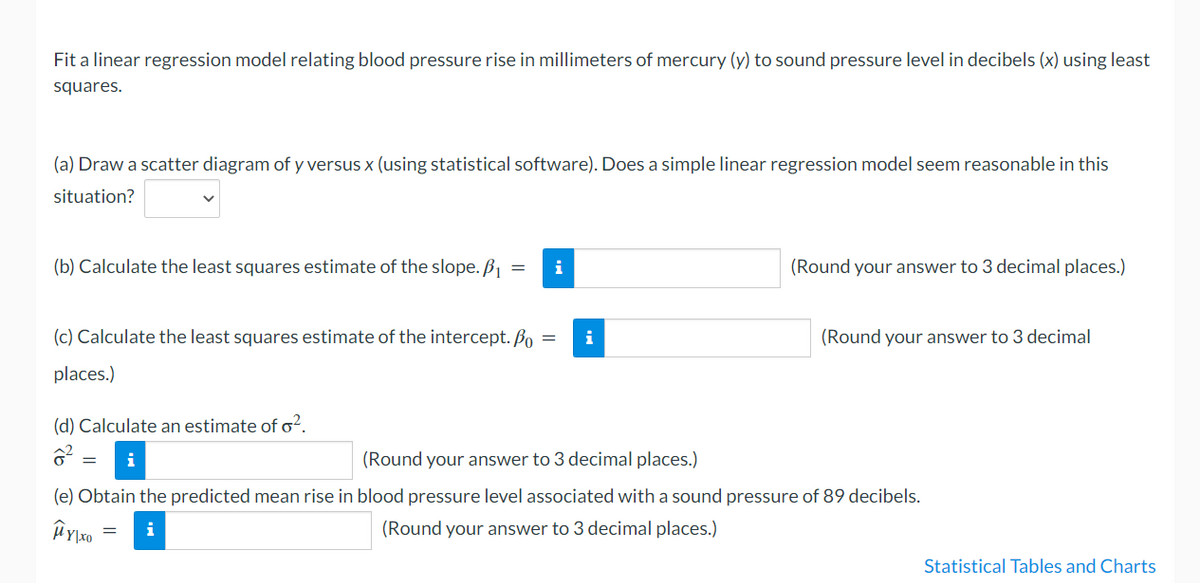
Transcribed Image Text:Fit a linear regression model relating blood pressure rise in millimeters of mercury (y) to sound pressure level in decibels (x) using least
squares.
(a) Draw a scatter diagram of y versus x (using statistical software). Does a simple linear regression model seem reasonable in this
situation?
(b) Calculate the least squares estimate of the slope. B1 =
(Round your answer to 3 decimal places.)
(c) Calculate the least squares estimate of the intercept. Bo =
i
(Round your answer to 3 decimal
places.)
(d) Calculate an estimate of o?.
(Round your answer to 3 decimal places.)
(e) Obtain the predicted mean rise in blood pressure level associated with a sound pressure of 89 decibels.
i
(Round your answer to 3 decimal places.)
Statistical Tables and Charts
Expert Solution
This question has been solved!
Explore an expertly crafted, step-by-step solution for a thorough understanding of key concepts.

This is a popular solution!

Trending now
This is a popular solution!

Step by step
Solved in 4 steps with 1 images

Recommended textbooks for you
Glencoe Algebra 1, Student Edition, 9780079039897…
Algebra
ISBN:
9780079039897
Author:
Carter
Publisher:
McGraw Hill

Functions and Change: A Modeling Approach to Coll…
Algebra
ISBN:
9781337111348
Author:
Bruce Crauder, Benny Evans, Alan Noell
Publisher:
Cengage Learning
Glencoe Algebra 1, Student Edition, 9780079039897…
Algebra
ISBN:
9780079039897
Author:
Carter
Publisher:
McGraw Hill
Functions and Change: A Modeling Approach to Coll…
Algebra
ISBN:
9781337111348
Author:
Bruce Crauder, Benny Evans, Alan Noell
Publisher:
Cengage Learning