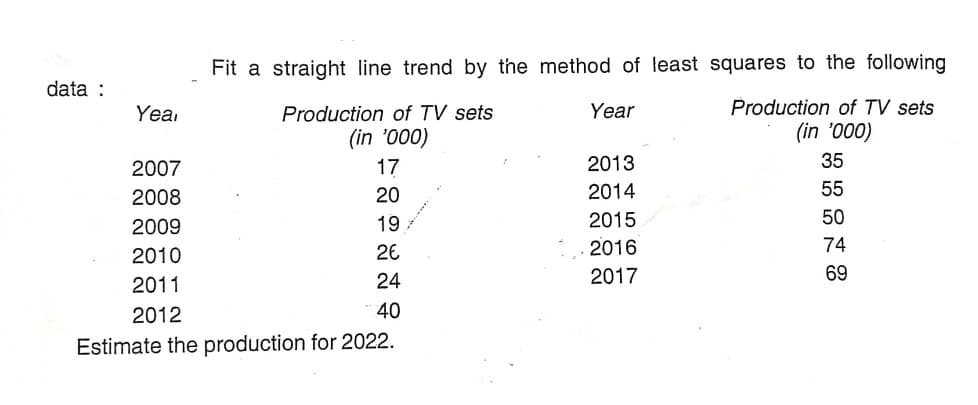
Fit a straight line trend by the method of least squares to the following data : Yea Production of TV sets Year Production of TV sets (in '000) (in '000) 2007 17 2013 35 2008 20 2014 55 2009 19 2015 50 2010 26 2016 74 2011 24 2017 69 2012 40 Estimate the production for 2022.


Q: i) If you have twenty ones and fifteen zeroes how many ways can we arrange these digits such that no...
A: Disclaimer : Since you have asked multiple question, we will solve the first question for you. If yo...
Q: HOME Realty dlaims that it can sell a detached, residential house faster than any other realty compa...
A: Given: Histogram
Q: researcher wants to know how long it takes, on average, for a certain species of bacteria to divide....
A: We have given that data 6.7, 10.5, 4.8, 5.2, 5.2, 10.6, 4.4, 5.7, 10.9, 7.5, 5.3, 4.4, 5.7, 5.2, 6....
Q: Employers want to know which days of the week employees are absent in a five-day work week. Most emp...
A: Data given 16 11 9 10 14
Q: Estimate the production for 2022.
A: Here take x = year y = production of TV sets in 1000
Q: any impact on people's behavior. Before the new tax, convenience stores in the city sold an average ...
A: Given average of μ = 410, sugar filled beverages per day with (Sigma) = 60. sample of n = 9 days me...
Q: Use the method of least squares to fit a straight line trend and estimate the number of salesmen in ...
A: Here X= Year Number Y= Number of salesman Total number of data =n=5 Here We will use least square ...
Q: 10. Let the discrete random variable X be the number of odd numbers that appear in 16 tosses of a fa...
A: Let X be the number of odd numbers that appear in 16 tosses of a fair die Probability that an odd n...
Q: 8. In the period of 2010 - 2020 in the United States 1/3 of patients 55 years old or older had a sea...
A:
Q: What is the area of the region to the right of z = 0.88? Notes: 1. Write your answer using four deci...
A:
Q: A survey conducted by the American Automoble Association showed that a family of four spends an aver...
A: We have given that Sample size n =64 Sample mean =254.45 Sample standard deviation =76.50 Population...
Q: 6. Two factories (X and Y) are producing light bulbs. To decide which one produces better products, ...
A: Any assumption about the parameter or probability function is known as hypothesis testing. For the g...
Q: Based on data from the 2000 Census the average age of a Baldwin County, Alabama resident is 39 years...
A: We have given that Population mean =39 Population standard deviation =22.6
Q: 1. The Central Limit Theorem allows for a researcher to: a. estimate the sampling distribution of a...
A: The objective is to choose correct alternative for given questions.
Q: 3.108 Find the numerical values of 6. а. b. Р P с. d.
A: Here we need to find out the permutation and combination. Permutation formula: P(n,r) = n!/(n-r)! Co...
Q: Fill in the P (X=x) values to give a legitimate probability distribution for the discrete random var...
A:
Q: The hypothesis shown below is being tested. The test statistic calculated by the analyst was Z = +1....
A: The test statistic is 1.76 This is a two-tailed test as the direction of alternative hypothesis is "...
Q: Suppose a survey of a random sample of 100 smokers, conducted by the Department of Health, suggests ...
A:
Q: Let X denote the distance (m) that an animal moves from its birth site to the first territorial vaca...
A: Given The cumulative distribution function of X is
Q: Susan, a personal trainer, was interested in whether or not there was a linear relationship between ...
A: Regression equation for best fit line. Y= b0 + b1 *X
Q: The probability that the flowers on your table are purple when you dine at a certain fine dining res...
A:
Q: Express the confidence interval (35.8 % , 52.8 % ) in the form of p ± E.
A: Given that l.b =35.8 ,u.b =52.8 P hat = ? E =?
Q: Consider the following time series data. Week 4 Value 18 14 15 12 18 14 Using the average of all the...
A:
Q: Below are given the annual production figures (in thousand tonnes) Fertiliser factory: Year 2011 201...
A:
Q: A random sample of 25 kids were asked about their favorite animated movie and here are their answers...
A: The objective is to find what percent of the respondent answer toy story and find highest frequency...
Q: (b) Compare a three-month moving average forecast with the exponential smoothing forecast for a - 0....
A: Given information:- Month Sales 1 80 2 82 3 84 4 83 5 84 6 84 7 85 8 84 9 82 ...
Q: are in each Big Chip cookie at her bakery. She randomly selects a sample of 41 cookies and finds tha...
A: Given Since the population standard deviation is unknown here and we are using sample standard devia...
Q: Below is a probability distribution for the number of math failures of BC students. 1 2 3 4. P(X) .4...
A:
Q: To assess whether a data set fits a specific distribution, you can apply the ____________hypothesis ...
A: Solution-: We fill the following sentence with appropriate choices. To assess whether a data set fit...
Q: The following is a list of 15 measurements. -16, -39, -6, –-47, 24, -65, –80, 29, 74, 53, 50, 26, 11...
A:
Q: A community epidemiology study conducted fasting blood tests on a large community a obtained the fol...
A: It is given the mean and standard deviation of males are 100 and 30.
Q: A plane's consumption of gas is normally distributed. Assume the mean is 250 L per day and the stand...
A:
Q: An experiment consists of asking 3 women at random if they wash their dishes with brand X detergent.
A: As per bartleby guidelines I can't answer more than three sub parts per post. Please post other sub...
Q: A coin is flipped 5 times. Find the probability of getting at least 3 heads. If you used a table to...
A:
Q: how many 5 letter codes can be made this time if the letter "b" must be the first letter of the cod...
A: Let the original 7 letters are given as (a, b, c, d, e, f, g). Here, 5 letter code is to form from o...
Q: Which of the following is TRUE about a 99% confidence interval for the true average amount of time t...
A: Here we need to interpret about a 99% confidence interval for the true average amout of time that ...
Q: 4. The recommended daily dietary allowance for zinc among males older than age 50 years is 15 mg/day...
A: Any assumption about the parameter or probability function is known as hypothesis testing. For the g...
Q: A sample of n = 81 from a population of u = 80 and o = 18 has a mean M = 81. What is the z-score for...
A: Solution-: Given: n=81,μ=80,σ=18,M=18 We find the z-score for the sample means?
Q: Consider a political discussion group consisting of 7 Democrats, 3 Republicans, and 8 Independents. ...
A:
Q: Individual Experience Experience of Others Combination 24.5 20.6 21.0 ...
A: For the given data Perform Anova one way test to test the claim that errors are equal.
Q: X is distributed as a Normal random variable with mean of 80 and a standard deviation of 10 (i.e X~N...
A:
Q: 6. A sample of n 81 from a population of µ = 80 and o = 18 has a mean M = 46. What is the om for the...
A:
Q: Days Sick Monday 330 Tuesday 280 Wednesday 330 Thursday 300 Friday 290 Saturday 295 The...
A: It is needed to test, whether the daily sick leave usage is consistent (equal).
Q: If four cards are drawn from an ordinary deck without replacement, what is the probability that at l...
A: NOTE-AS PER POLICY I HAVE CALCULATED FIRST MAIN QUESTION ONLY Here 4 cards are drawn from ordinary d...
Q: Use the method of least squares to fit a straight line trend and estimate the number of salesmen in ...
A: Here Given Data for number of salesman in different years Now here x=Year s= Number of Salesman Her...
Q: To assess whether two factors are independent or not, you can apply the test of independence that us...
A: Solution-: As below we fill up given sentence with group of answer choices To assess whether two fac...
Q: 36. Find the mean for the following frequency tables. a. Grade Frequency 49.5–59.5 2 59.5–69.5 3 ...
A: Since you have posted multiple questions, as per our guidelines we have provided answer for first qu...
Q: In a large section of statistics class for the final exam are normally distributed, with a mean of 7...
A: Given: μ=72σ=9x~N(72,92)
Q: Test the claim about the population mean, p, at the given level of significance using the given samp...
A:
Q: According to a survey conducted by TD Ameritrade, one out of four investors have exchange-traded fun...
A:

Step by step
Solved in 2 steps

- The Abendigo Division of Block C Enterprises has a product designed to operate for 1000 hours with a failure rate of 2.2%. Calculate the Mean Time to Failure.The amount (in millions of dollars) of used autos sold online in a certain country from 2011 to 2015 is given in the following table (x = 0 corresponds to 2011). Year, x 0 1 2 3 4 Sales, y 12.9 13.9 14.65 15.25 15.85 (a) Find an equation of the least-squares line for these data.y = (b) Use the result of part (a) to estimate the sales of used autos online in 2016, assuming that the predicted trend continued. (Round your answer to one decimal place.)$ millionThe following table is an abbreviated life expectancy table for males. current age, x 0 20 40 60 80 life expectancy, y 76.6 years 78.9 years 80.5 years 81.7 years 82.7 years a. Find the straight line that provides the best least-squares fit for these data.
- Suppose a special type of small data processing firm is so specialized that some have difficulty making a profit in their first year of operation. what is the value of k?A UPS efficiency expert is interested in finding out if the years of driving experience (EXP) can be used to predict the frequency of late deliveries (LATE). Here are the data (late deliveries are per 100 ): EXP ZEXP LATE ZLATE 16 0.49 8 0.43 19 1.34 10 1.45 15 0.21 7 -0.09 15 0.21 8 0.43 14 -0.07 6 -0.60 15 0.21 8 0.43 13 -0.35 5 -1.11 12 -0.64 5 -1.11 4 -2.90 3 -2.14 15 0.21 8 0.43 16 0.49 9 0.94 17 0.78 9 0.94 MEXP = 14.25 SDEXP = 3.54 MLATE= 7.17 SDLATE = 1.95 Use α = .05 for all decisions. Determine how many late deliveries (per 100) we would predict for a driver with 20 years of experience. No explanation is required – just report the predicted value as your final answer.Table 7 gives the number of visitors per year at YosemiteNational Park.(a) Find the least-squares line for these data.(b) Estimate the number of visitors in 2017.
- Find the curve of best-fit y = axb to the following data by using the method of least square.Customers arrive to a local bakery with an average time between arrivals of5 minutes. However, there is quite a lot of variability in the customers’ arrivals, asone would expect in an unscheduled system. The single bakery server requires anamount of time having the exponential distribution with mean 4.5 minutes to servecustomers (in the order in which they arrive). No customers leave without service.f. Why are the estimated waits in this system so long? Are the assumptions behindthem reasonable? Why or why not?The proportion p of residents in a community who recycle has traditionally been 60% . A policy maker claims that the proportion is less than 60% now that one of the recycling centers has been relocated. If 101 out of a random sample of 200 residents in the community said they recycle, is there enough evidence to support the policy maker's claim at the 0.10 level of significance?Perform a one-tailed test. Then complete the parts below.Carry your intermediate computations to three or more decimal places. (If necessary, consult a list of formulas.) (a) State the null hypothesis H0 and the alternative hypothesis H1 . H0: H1: (b) Determine the type of test statistic to use. ▼(Choose one) (c) Find the value of the test statistic. (Round to three or more decimal places.) (d) Find the p-value. (Round to three or more decimal places.) (e) Is there enough evidence to support the policy maker's…
- The proportion p of residents in a community who recycle has traditionally been 60% . A policy maker claims that the proportion is less than 60% now that one of the recycling centers has been relocated. If 128 out of a random sample of 240 residents in the community said they recycle, is there enough evidence to support the policy maker's claim at the 0.01 level of significance? Perform a one-tailed test. Then complete the parts below. Carry your intermediate computations to three or more decimal places. (If necessary, consult a list of formulas.) (a) State the null hypothesis H0 and the alternative hypothesis H1 . H0: H1: (b) Determine the type of test statistic to use. ▼(Choose one) (c) Find the value of the test statistic. (Round to three or more decimal places.) (d) Find the critical value. (Round to three or more decimal places.) (e) Is there enough evidence to support the policy maker's claim that the…The proportion p of residents in a community who recycle has traditionally been 60% . A policy maker claims that the proportion is less than 60% now that one of the recycling centers has been relocated. If 126 out of a random sample of 215 residents in the community said they recycle, is there enough evidence to support the policy maker's claim at the 0.10 level of significance? Perform a one-tailed test. Then complete the parts below. Carry your intermediate computations to three or more decimal places. (If necessary, consult a list of formulas.) (a) State the null hypothesis H0 and the alternative hypothesis H1 . H0: H1: (b) Determine the type of test statistic to use. ▼(Choose one) (c) Find the value of the test statistic. (Round to three or more decimal places.) (d) Find the p-value. (Round to three or more decimal places.) (e) Is there enough evidence to support the policy maker's claim that the…Design a 3rd order Least-squares function approximation to interpolate between the mid between (2n and 3") for a dataset as chosen by you. Compute the LS model error.