Five samples of a ferrous-type substance were used to determine if there is a difference between a laboratory chemical analysis and an X-ray fluorescence analysis of the iron content. Each sample was split into two subsamples and the two types of analysis were applied, with the accompanying results. Assuming that the populations are normal, test at the 0.01 level of significance whether the two methods of analysis give, on the average, the same result. Click here to view the sample analyses. Click here to view page 1 of the table of critical values of the t-distribution.
Five samples of a ferrous-type substance were used to determine if there is a difference between a laboratory chemical analysis and an X-ray fluorescence analysis of the iron content. Each sample was split into two subsamples and the two types of analysis were applied, with the accompanying results. Assuming that the populations are normal, test at the 0.01 level of significance whether the two methods of analysis give, on the average, the same result. Click here to view the sample analyses. Click here to view page 1 of the table of critical values of the t-distribution.

Glencoe Algebra 1, Student Edition, 9780079039897, 0079039898, 2018
18th Edition
ISBN:9780079039897
Author:Carter
Publisher:Carter
Chapter4: Equations Of Linear Functions
Section: Chapter Questions
Problem 8SGR

Related questions
Topic Video
Question
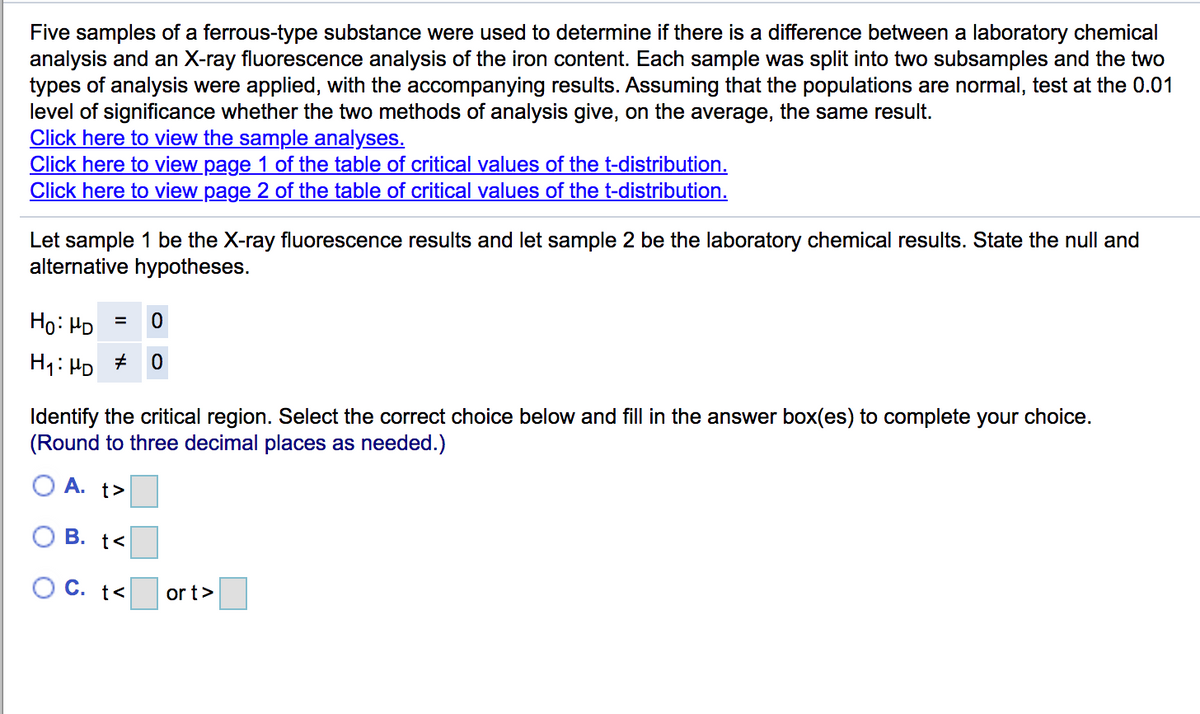
Transcribed Image Text:Five samples of a ferrous-type substance were used to determine if there is a difference between a laboratory chemical
analysis and an X-ray fluorescence analysis of the iron content. Each sample was split into two subsamples and the two
types of analysis were applied, with the accompanying results. Assuming that the populations are normal, test at the 0.01
level of significance whether the two methods of analysis give, on the average, the same result.
Click here to view the sample analyses.
Click here to view page 1 of the table of critical values of the t-distribution.
Click here to view page 2 of the table of critical values of the t-distribution.
Let sample 1 be the X-ray fluorescence results and let sample 2 be the laboratory chemical results. State the null and
alternative hypotheses.
Ho: HD
%3D
H1: HD
Identify the critical region. Select the correct choice below and fill in the answer box(es) to complete your choice.
(Round to three decimal places as needed.)
A. t>
В. t<
O C. t<
or t>
Expert Solution
This question has been solved!
Explore an expertly crafted, step-by-step solution for a thorough understanding of key concepts.

This is a popular solution!

Trending now
This is a popular solution!

Step by step
Solved in 2 steps

Knowledge Booster


Learn more about
Need a deep-dive on the concept behind this application? Look no further. Learn more about this topic, statistics and related others by exploring similar questions and additional content below.Recommended textbooks for you
Glencoe Algebra 1, Student Edition, 9780079039897…
Algebra
ISBN:
9780079039897
Author:
Carter
Publisher:
McGraw Hill
Glencoe Algebra 1, Student Edition, 9780079039897…
Algebra
ISBN:
9780079039897
Author:
Carter
Publisher:
McGraw Hill