following pency hist sample eventn-grade stude ured to the nearest whoie umber. The frequency of each class is labeled above each rectangle. Use the histogram to answers parts (a) through (g). a) How many students were sampled? students b) Determine the class width. The class width is c) Identify the classes and their frequencies. Choose the correct answer below. O A. 60-70, 1; 70-80, 4; 80-90, 13; 90-100, 52; 100-110, 44: 110-120, 41: 120-130, 32; 130-140, 7; 140-150, 4; 150-160, 2 O B. 60-69, 1; 70-79, 4; 80-89, 13; 90-99, 52; 100-109, 44; 110-119, 41; 120-129, 32; 130-139, 7; 140-149, 4; 150-159, 2 OC. 65, 1; 75, 4; 85, 13; 95, 52; 105, 44; 115, 41; 125, 32; 135, 7; 145, 4; 155, 2 d) Which class has the highest frequency? DA. 90-100 ОВ. 100-109 с. 90-99 D D. 95 e) Which class has the lowest frequency? DA. 60-69 О В. 150-159 OC. 60-70 O D. 65
following pency hist sample eventn-grade stude ured to the nearest whoie umber. The frequency of each class is labeled above each rectangle. Use the histogram to answers parts (a) through (g). a) How many students were sampled? students b) Determine the class width. The class width is c) Identify the classes and their frequencies. Choose the correct answer below. O A. 60-70, 1; 70-80, 4; 80-90, 13; 90-100, 52; 100-110, 44: 110-120, 41: 120-130, 32; 130-140, 7; 140-150, 4; 150-160, 2 O B. 60-69, 1; 70-79, 4; 80-89, 13; 90-99, 52; 100-109, 44; 110-119, 41; 120-129, 32; 130-139, 7; 140-149, 4; 150-159, 2 OC. 65, 1; 75, 4; 85, 13; 95, 52; 105, 44; 115, 41; 125, 32; 135, 7; 145, 4; 155, 2 d) Which class has the highest frequency? DA. 90-100 ОВ. 100-109 с. 90-99 D D. 95 e) Which class has the lowest frequency? DA. 60-69 О В. 150-159 OC. 60-70 O D. 65

Algebra & Trigonometry with Analytic Geometry
13th Edition
ISBN:9781133382119
Author:Swokowski
Publisher:Swokowski
Chapter8: Applications Of Trigonometry
Section8.5: Trigonometric Form For Complex Numbers
Problem 6E

Related questions

Question
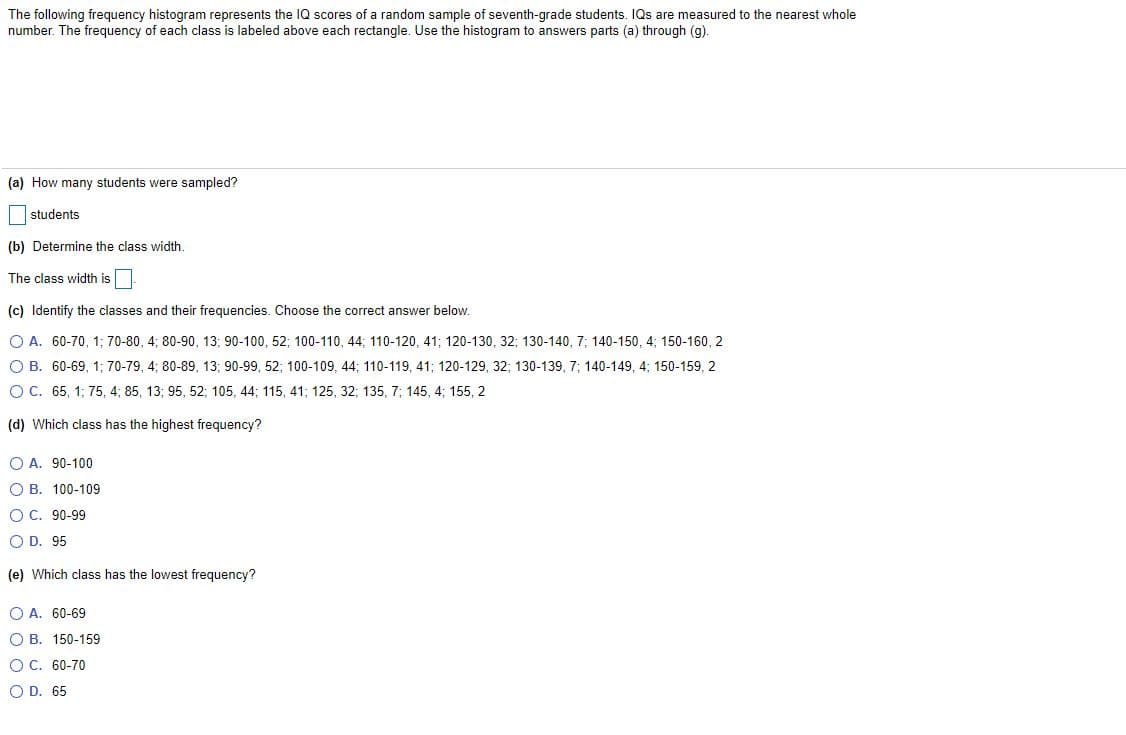
Transcribed Image Text:The following frequency histogram represents the IQ scores of a random sample of seventh-grade students. IQs are measured to the nearest whole
number. The frequency of each class is labeled above each rectangle. Use the histogram to answers parts (a) through (g).
(a) How many students were sampled?
students
(b) Determine the class width.
The class width is
(c) Identify the classes and their frequencies. Choose the correct answer below.
O A. 60-70, 1; 70-80, 4; 80-90, 13; 90-100, 52; 100-110, 44; 110-120, 41; 120-130, 32; 130-140, 7; 140-150, 4; 150-160, 2
O B. 60-69, 1; 70-79, 4; 80-89, 13; 90-99, 52; 100-109, 44; 110-119, 41; 120-129, 32; 130-139, 7; 140-149, 4; 150-159, 2
O C. 65, 1; 75, 4; 85, 13; 95, 52; 105, 44; 115, 41; 125, 32; 135, 7; 145, 4; 155, 2
(d) Which class has the highest frequency?
O A. 90-100
O B. 100-109
OC. 90-99
O D. 95
(e) Which class has the lowest frequency?
O A. 60-69
O B. 150-159
OC. 60-70
O D. 65
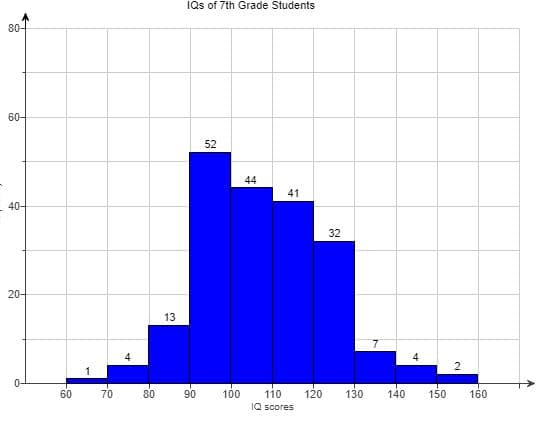
Transcribed Image Text:IQs of 7th Grade Students
80-
60-
52
44
41
40-
32
20-
13
4
4
0-
60
70
80
90
100
150
110
IQ scores
120
130
140
160
2.
Expert Solution
This question has been solved!
Explore an expertly crafted, step-by-step solution for a thorough understanding of key concepts.

This is a popular solution!

Trending now
This is a popular solution!

Step by step
Solved in 3 steps

Knowledge Booster


Learn more about
Need a deep-dive on the concept behind this application? Look no further. Learn more about this topic, statistics and related others by exploring similar questions and additional content below.Recommended textbooks for you
Algebra & Trigonometry with Analytic Geometry
Algebra
ISBN:
9781133382119
Author:
Swokowski
Publisher:
Cengage
Algebra & Trigonometry with Analytic Geometry
Algebra
ISBN:
9781133382119
Author:
Swokowski
Publisher:
Cengage