For 365 days, an environmental scientist collected the highest temperature in Florida (in Fahrenheit) per day. What is the most appropriate graph to use to display this data? bar graph Opie graph histogram scatterplot
For 365 days, an environmental scientist collected the highest temperature in Florida (in Fahrenheit) per day. What is the most appropriate graph to use to display this data? bar graph Opie graph histogram scatterplot

College Algebra (MindTap Course List)
12th Edition
ISBN:9781305652231
Author:R. David Gustafson, Jeff Hughes
Publisher:R. David Gustafson, Jeff Hughes
Chapter2: Functions And Graphs
Section2.6: Proportion And Variation
Problem 32E

Related questions
Question
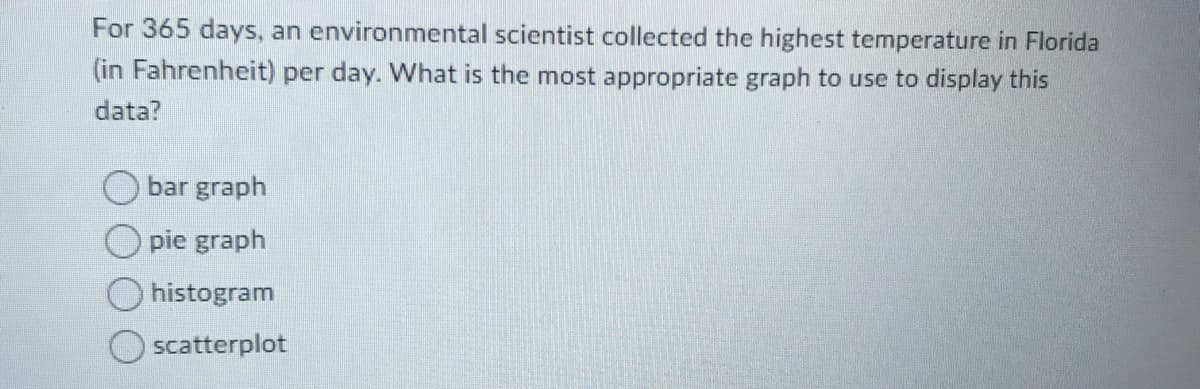
Transcribed Image Text:For 365 days, an environmental scientist collected the highest temperature in Florida
(in Fahrenheit) per day. What is the most appropriate graph to use to display this
data?
bar graph
pie graph
histogram
scatterplot
Expert Solution
This question has been solved!
Explore an expertly crafted, step-by-step solution for a thorough understanding of key concepts.

Step by step
Solved in 2 steps

Knowledge Booster


Learn more about
Need a deep-dive on the concept behind this application? Look no further. Learn more about this topic, statistics and related others by exploring similar questions and additional content below.Recommended textbooks for you
College Algebra (MindTap Course List)
Algebra
ISBN:
9781305652231
Author:
R. David Gustafson, Jeff Hughes
Publisher:
Cengage Learning

Algebra: Structure And Method, Book 1
Algebra
ISBN:
9780395977224
Author:
Richard G. Brown, Mary P. Dolciani, Robert H. Sorgenfrey, William L. Cole
Publisher:
McDougal Littell
College Algebra (MindTap Course List)
Algebra
ISBN:
9781305652231
Author:
R. David Gustafson, Jeff Hughes
Publisher:
Cengage Learning
Algebra: Structure And Method, Book 1
Algebra
ISBN:
9780395977224
Author:
Richard G. Brown, Mary P. Dolciani, Robert H. Sorgenfrey, William L. Cole
Publisher:
McDougal Littell