For 50 randomly selected speed dates, attractiveness ratings by males of their female date partners (x) are recorded along with the attractiveness ratings by females of their male date partners (y); the ratings range from 1 to 10. The 50 paired ratings yield x= 6.4, y = 6.0, r = - 0.229, P-value = 0.109, and y=7.82 -0.283x. Find the best predicted value of y (attractiveness rating by female of male) for a date in which the attractiveness rating by the male of the female is x = 7. Use a 0.10 significance level. The best predicted value of y when x = 7 is (Round to one decimal place as needed.)
For 50 randomly selected speed dates, attractiveness ratings by males of their female date partners (x) are recorded along with the attractiveness ratings by females of their male date partners (y); the ratings range from 1 to 10. The 50 paired ratings yield x= 6.4, y = 6.0, r = - 0.229, P-value = 0.109, and y=7.82 -0.283x. Find the best predicted value of y (attractiveness rating by female of male) for a date in which the attractiveness rating by the male of the female is x = 7. Use a 0.10 significance level. The best predicted value of y when x = 7 is (Round to one decimal place as needed.)

Glencoe Algebra 1, Student Edition, 9780079039897, 0079039898, 2018
18th Edition
ISBN:9780079039897
Author:Carter
Publisher:Carter
Chapter10: Statistics
Section10.1: Measures Of Center
Problem 9PPS

Related questions
Question
3q
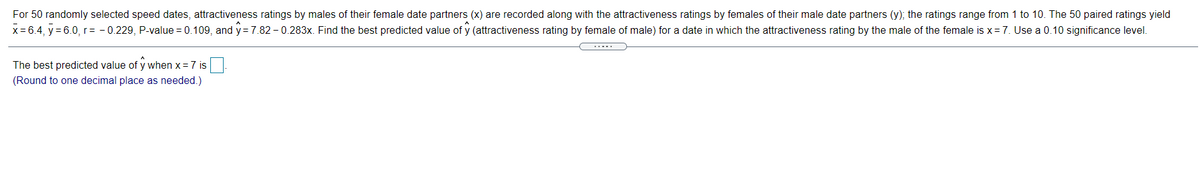
Transcribed Image Text:For 50 randomly selected speed dates, attractiveness ratings by males of their female date partners (x) are recorded along with the attractiveness ratings by females of their male date partners (y); the ratings range from 1 to 10. The 50 paired ratings yield
x= 6.4, y = 6.0, r= - 0.229, P-value = 0.109, and y =7.82 - 0.283x. Find the best predicted value of y (attractiveness rating by female of male) for a date in which the attractiveness rating by the male of the female is x= 7. Use a 0.10 significance level.
The best predicted value of y when x = 7 is
(Round to one decimal place as needed.)
Expert Solution
This question has been solved!
Explore an expertly crafted, step-by-step solution for a thorough understanding of key concepts.

Step by step
Solved in 2 steps

Recommended textbooks for you
Glencoe Algebra 1, Student Edition, 9780079039897…
Algebra
ISBN:
9780079039897
Author:
Carter
Publisher:
McGraw Hill
Glencoe Algebra 1, Student Edition, 9780079039897…
Algebra
ISBN:
9780079039897
Author:
Carter
Publisher:
McGraw Hill