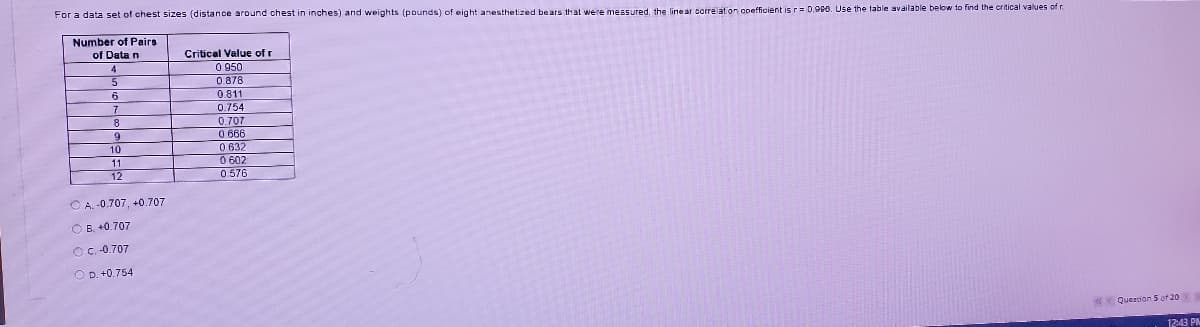
For a data set of chest sizes (distance around chest in inches) and weights (pounds) of eight anesthetized bears that were measured, the linear corre at on opefficient isr= 0.000. Use the table available below to find the crtical values o r. Number of Pairs of Data n Critical Value of r 0 950 0 878 0.811 0.754 6 7 8 9 10 0.707 0 666 0 632 0 602 0 576 11 12 A. -0.707, +0.707 O B. 40.707 O C.-0.707 O D. +0.754


Q: The price-earnings (PE) ratios of a sample of stocks have a mean value of 14.5 and a standard deviat...
A:
Q: You are interested to see if there is a difference in the student’s CGPA for the three different pro...
A: Given information: Programme GPA BB05 3.67 BB08 3A 3.9 BB02 3.28 BB05 3.29 BB05 3.32 ...
Q: If the portfolio is 500,000, with the significance level of 1%, what would be the absolute value of ...
A: Given Information: The return on the portfolio for the given days is given.
Q: Human Blood Types Human blood is grouped into four types. The percentages of Americans with each typ...
A: Human blood types, human blood is grouped into four types. the percentages of americans with each ty...
Q: What is the sample size now? What religious category is the mode? What percentage are in this catego...
A: Given information: Valid Frequency Percent Valid Percent Cumulative Percent No religion 21 ...
Q: Calculate mean deviation (from arithmetic mean) from the following values : 100.500 100.250 100.375 ...
A:
Q: Need help answering and showing the work so I can look at how to do it
A: Trailer views Box office gross 7.344 20.368 81.471 102.309 35.286 65.127 20.31 19.108 3.36...
Q: researcher published this survey result: "74% of people would be willing to spend 10 percent more fo...
A: * ANSWER ::- (1)
Q: 4:3 against her husband now 50 living till he is 80. Find the probability that Example 3-47. It is 8...
A:
Q: What is the type I error for x-bar control charts with 3-sigma control limits and 0.001 probability...
A: @solution:::
Q: The population of a country was 300 million in 1951. It became 520 million in 1969. Calculate the pe...
A:
Q: The arithmetic mean of two observations is 127.5, and their geometric mean is 60. Find their harmoni...
A:
Q: From a box containing 4 black balls and 3 green balls, 4 balls are drawn in succession. Let Y be a r...
A:
Q: Example 5. Calculate the arithmetic average of the following by the direct method : Weekly wages (in...
A:
Q: If X and Y are independent RVs, then E(YIX) - F(Y) nd F(Y10
A: X and Y are independent then joint distribution of X and Y is f(x,y)=f(x)f(y)
Q: Whenever Suzan sees a bag of marbles, she grabs a handful at random. She has seen a bag containing t...
A:
Q: (b) For a set of 100 observations, the sum of deviations from 4 is -11, and the sum of the squares o...
A:
Q: What is the relationship between the critical value with the level of significance (alpha)?
A: here use basic of significance level and critical value
Q: Choose the correct description of the mean below. O A. The mean is the middle value in a data set. I...
A: The mean is the sum of all the values divided by the number of values. It can be strongly affected b...
Q: Find the values of Qj, Q3, Dz and P4, from the following data: Marks No. of Students more than 70 7 ...
A: Given that We have to find the first quartile Q1, third Quartile Q3, third decile D3, 40th percent...
Q: Suppose n = 41 and p = 0.37. Can we approximate p̂ by a normal distribution? Why? (Use 2 decimal pla...
A:
Q: Example 5. Calculate 5-yearly and 7-yearly moving average of the data given below to obtain trend va...
A:
Q: The mean weight of 150 students in a certain class is 60 kg. The mean weight of boys in the class is...
A:
Q: The population mean and standard deviation are given below. Find the required probability and determ...
A:
Q: Find the mean and variance of the Pascal's (negative binomial distribution) n + k – 1 distribution, ...
A:
Q: Please consider and work through the following questions. Breast cancer patients Normal individuals ...
A:
Q: A: {herding dogs} B: {Dogs that jump 20 inches} C: {Dogs that run with no faults} (a) Write...
A:
Q: Given Series A Series B Mean 50 40 Standard deviation 5 6. No. of items 100 150 Find the combined me...
A:
Q: Find the characteristic function of the Laplace distribution with pdf f(x) = 2 - 00 <X < o0, Hence f...
A:
Q: Derive the standard error of the point estimator Bo-
A:
Q: Stanford University conducted a study of whether running is healthy for men and women over age 50. D...
A:
Q: Four students are playing a card game. They decide to choose the first person to play by each select...
A: Given: Four students are playing a card game. They decide to choose the first person to play by each...
Q: Number 1: The serum cholesterol levels of a population of 12 to 14 year olds follow a normal distrib...
A: Let X denotes the cholesterol levels of population X ~ N(162, 28)
Q: 1. Skewness: Describe the shape of the following three distributions & lescribe the relationship to ...
A: Solution: First we understand the relationship between central tendencies measures ( mean, median ...
Q: The arithmetic mean of two observations is 127.5, and their geometric mean is 60. Find their harmoni...
A: Given that Arithmetic mean=A.M=127.5 Geometric mean=G.M=60
Q: The following data relate to the prices and quantities of 4 commodities in the years 2012 and 2013. ...
A:
Q: Find the characteristic function of the Poisson distribution and hence find the values of the first ...
A:
Q: Compute the value of the correlation coefficient between time spend for studying and current CGPA an...
A: Solution: Let x be the time spend for studying and y be the current CGPA of student. Formula: Correl...
Q: The standard deviation of 15 scores was 5 and the mean was 85. What was the variance. 2. Compute t...
A: Note: Please repost remaining questions as I can author only 1 question as per my policy Given data,...
Q: - The population of a country was 300 million in 1951. It became 520 million in 1969. Calculate the ...
A:
Q: From a box containing 4 black balls and 3 green balls, 4 balls are drawn in succession. Let Y be a r...
A: Since you have posted a question with multiple sub-parts, as per our guidelines we have provided ans...
Q: Construct the confidence interval for the population mean μ. c=0.95, x=8.1, σ=0.3, and n= 40
A:
Q: Based on historical data, an insurance company estimates that a particular customer has a 1.5% likel...
A:
Q: Example 3-51. A and B alternately cut a pack of cards and the pack is shuffled after each cut. If A ...
A:
Q: accompanying data are the length (in centimeters) and girths (in centimeters) of 12 harbor seals. ...
A: Given data, X Y X*Y X*X 136 107 14552 18496 168 130 21840 28224 152 115 17480 23104 145 1...
Q: An inventory study determines that, on average, demands for a particular item at a warehouse are mad...
A:
Q: Use the probability distribution to complete parts (a) and (b) below. Activities Probability 0...
A: Given: Activities Probability 0 0.061 1 0.124 2 0.166 3 0.167 4 0.203 5 0.119 6 0...
Q: - TABLE 6E.2 Bearing Diameter Data Sample Sample Number i R Number 1 34.5 3 13 35.4 8 34.2 4 14 34.0...
A: Given Information: Consider the table that shows the measurements which are made on the inside diame...
Q: In a symmetric distribution with HH = 48 and standard deviation o = 3 Approximately what percent of ...
A:
Q: (a) A distribution consists of three components with total frequencies of 200, 250 and'300 having me...
A: Given three problems related to mean. So, we to solve the problems as indicated in each problem.

Step by step
Solved in 2 steps

- Find the equation of the regression line for the following data set. x 1 2 3 y 0 3 4A real estate agent suggests that the median rent for one-bedroom apartment in a community is $325 per week. A sample of 12 one-bedroom homes shows the following weekly rents. At α =0.05, is there enough evidence to reject the agent's claim? $420 $460 $514 $405 $320 $435 $350 $531 $450 $560 $309 $325 A. Determine the critical value.Suppose you computed r=−0.285 using n=13 data points that were collected when studying the relationship between average weekly overtime and years working for a company. Using the critical values table below, determine if the value of r is significant or not. df12345678910CV (+ and -)0.9970.9500.8780.8110.7540.7070.6660.6320.6020.576df11121314151617181920CV (+ and -)0.5550.5320.5140.4970.4820.4680.4560.4440.4330.423df21222324252627282930CV (+ and -)0.4130.4040.3960.3880.3810.3740.3670.3610.3550.349df405060708090100CV (+ and -)0.3040.2730.2500.2320.2170.2050.195 Select the correct answer below: r is significant because it is between the positive and negative critical values. r is not significant because it is between the positive and negative critical values. r is significant because it is not between the positive and negative critical values. r is not significant because it is not between the positive and negative critical values.
- The results of an independent-measures research study are reported as "t(20) = 2.12, p < .05, two tails." For this study, what t values formed the boundaries for the critical region?The data given below indicate the existence of a linear relationship between the x and y variables. Suppose an analyst who prepared the solutions and carried out the RI measurements was not skilled and as a result of poor technique, allowed intermediate errors to appear. The results are the following:Concentration of solution in percent (x) 10 26 33 50 61Refractive indices (y) 1.497 1.493 1.485 1.478 1.477Step 1. Carefully plot the given x and y values (from the table) on a regular graphing paper. Label then connect the points to observe a zigzag plot due to the scattered points. Step 2: Copy and fill the table given below: x (x - x̄) (x - x̄) 2 y (y - ȳ) (y - ȳ) 2 (x - x̄) (y - ȳ) 10 1.497 26 1.49333 1.48550 1.47861 1.477∑ = ∑ = ∑ = ∑ = ∑ = ∑ = ∑ =x̄= ∑xi ÷ Nx̄= ȳ = ∑yi ÷ Nȳ = Step 3. After completing the table, present following computations and the interpretation.a. Calculate the correlation coefficient (r), using the working formula: r =Σ (x − x ) (y − ȳ)√(Σ(x − x )2)(Σ(y −…A series of tests of fire prevention sprinkler systems that use a foaming agent to quell the fire were performed to determine how long it took (in seconds) for the sprinklers to be activated after the detection of a fire by the system. The system has been designed so that the true average activation time is supposed to be at most 25 seconds. Do the data strongly indicate that the design specifications have not been met? The data for the test are given below: 27 41 22 27 23 35 30 33 24 27 28 22 24
- The average normal daily temperature ( in degree Celsius) and the corresponding average monthly precipitation( in inches ) for the month of June are shown below for seven randomly selected cities. Compute for the value of r, complete the table with the needed information. Temperature(x) 30 27 28 32 27 23 18 Precipitation(y) 3.4 1.8 3.5 3.6 3.7 1.5 0.2In studying the relationship between age and time spent exercising, suppose you computed r=−0.307 using n=20 data points. Using the critical values table below, determine if the value of r is significant or not. df CV (+ and -) df CV (+ and -) df CV (+ and -) df CV (+ and -) 1 0.997 11 0.555 21 0.413 40 0.304 2 0.950 12 0.532 22 0.404 50 0.273 3 0.878 13 0.514 23 0.396 60 0.250 4 0.811 14 0.497 24 0.388 70 0.232 5 0.754 15 0.482 25 0.381 80 0.217 6 0.707 16 0.468 26 0.374 90 0.205 7 0.666 17 0.456 27 0.367 100 0.195 8 0.632 18 0.444 28 0.361 9 0.602 19 0.433 29 0.355 10 0.576 20 0.423 30 0.349 Select the correct answer below: 1) r is significant because it is between the positive and negative critical values. 2) r is not significant because it is between the positive and negative critical values. 3) r is significant because it is not between the positive and negative critical values. 4) r is not significant because it is…The following data pertain to x, the amount of fertil-izer (in pounds) that a farmer applies to his soil, and y, his yield of wheat (in bushels per acre): xy xy xy112 33 88 24 37 2792 28 44 17 23 972 38 132 36 77 3266 17 23 14 142 38112 35 57 25 37 1388 31 111 40 127 2342 8 69 29 88 31126 37 19 12 48 3772 32 103 27 61 2552 20 141 40 71 1428 17 77 26 113 26 Assuming that the data can be looked upon as a randomsample from a bivariate normal population, calculate rand test its significance at the 0.01 level of significance.Also, draw a scattergram of these paired data and judgewhether the assumption seems reasonable.
- Given that n=82 data points are collected when studying the relationship between average daily temperature and time spent watching television, use the critical values table below to determine if a calculated value of r=−0.974 is significant or not. df CV (+ and -) df CV (+ and -) df CV (+ and -) df CV (+ and -) 1 0.997 11 0.555 21 0.413 40 0.304 2 0.950 12 0.532 22 0.404 50 0.273 3 0.878 13 0.514 23 0.396 60 0.250 4 0.811 14 0.497 24 0.388 70 0.232 5 0.754 15 0.482 25 0.381 80 0.217 6 0.707 16 0.468 26 0.374 90 0.205 7 0.666 17 0.456 27 0.367 100 0.195 8 0.632 18 0.444 28 0.361 9 0.602 19 0.433 29 0.355 10 0.576 20 0.423 30 0.349 Select the correct answer below: r is significant because it is between the positive and negative critical values. r is not significant because it is between the positive and negative critical values. r is significant because it is not between the positive and negative critical values. r is not…A study is made for a particular allergy medication in order to determine the length of relief it provides Y (in hours) in relation to the dosage of medication X (in mg). For this reason, ten patients were given different doses of the medication and were asked to report back when the medication seemed to wear off. Patient #1 #2 #3 #4 #5 #6 #7 #8 #9 #10 Dosage (x) Relief Hours (y) 3 3.5 4 5 6 6.5 7 8 8.5 9 9.1 5.5 12.3 9.2 14.2 16.8 22.0 18.3 24.5 22.7 (i) Draw a scatter diagram. (ii) Calculate the product moment correlation coefficient and comment on your answer. (iii) Construct the least squares regression line.Q1 A) List down the measures of central tendency and measures of dispersion 2) The operations manager of a plant that manufactures tires wants to compare the actual inner diameters of two grades of tires, each of B) which is expected to be 575 millimeters. A sample of five tires of each grade was selected, and the results representing the inner diameters of the tires, ranked from smallest to largest, are as follows. Grade X grade Y 568 570 575 578 584 573 574 575 577 578 requirement. a) for each of the tow grades of tries, compute the mwan, median, and standred deviation. b) which grade of tire providing better quality? explain. c) what would be the effect on your answer in (a) and (b) if the last value for grade Y were 588 insert 578 explain. C) The file contins the overall miles per gallon (MPG) OF 2010 family sedan: 24 21 22 23 24 34 34 34 20 20 22 22 44 32 20 20 22 20 39 20 Source:…
