For a given function P, following data is obtained, get values for mean and std-dev and Plot mean value vs number of simulations, and plot standard deviation vs number of simulation for given data: Data gotten:
For a given function P, following data is obtained, get values for mean and std-dev and Plot mean value vs number of simulations, and plot standard deviation vs number of simulation for given data: Data gotten:

Glencoe Algebra 1, Student Edition, 9780079039897, 0079039898, 2018
18th Edition
ISBN:9780079039897
Author:Carter
Publisher:Carter
Chapter10: Statistics
Section10.5: Comparing Sets Of Data
Problem 13PPS

Related questions
Question
neat and clean answer
Transcribed Image Text:Eor
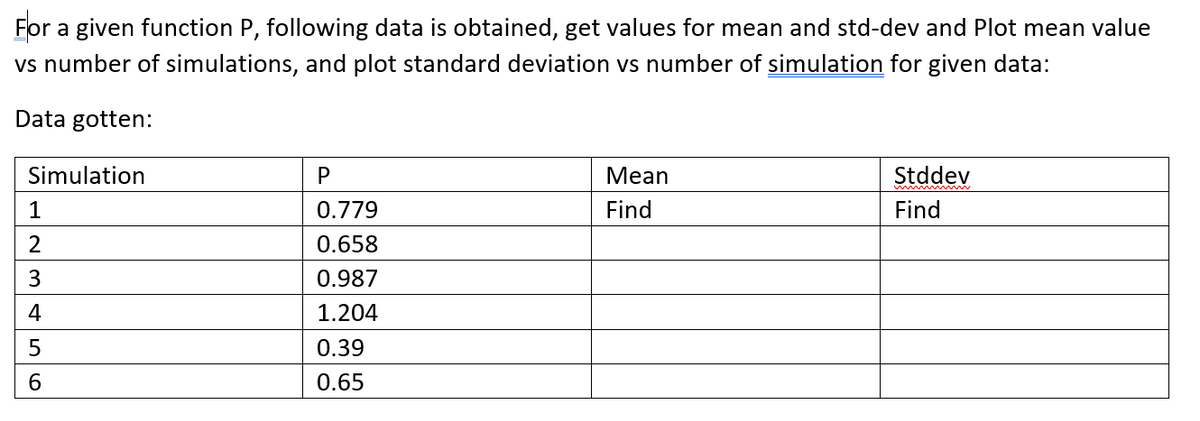
vs number of simulations, and plot standard deviation vs number of simulation for given data:
a given function P, following data is obtained, get values for mean and std-dev and Plot mean value
Data gotten:
Simulation
P
Мean
Stddev
1
0.779
Find
Find
2
0.658
3
0.987
4
1.204
0.39
6.
0.65
Expert Solution
This question has been solved!
Explore an expertly crafted, step-by-step solution for a thorough understanding of key concepts.

Step by step
Solved in 2 steps

Recommended textbooks for you
Glencoe Algebra 1, Student Edition, 9780079039897…
Algebra
ISBN:
9780079039897
Author:
Carter
Publisher:
McGraw Hill

Big Ideas Math A Bridge To Success Algebra 1: Stu…
Algebra
ISBN:
9781680331141
Author:
HOUGHTON MIFFLIN HARCOURT
Publisher:
Houghton Mifflin Harcourt
Glencoe Algebra 1, Student Edition, 9780079039897…
Algebra
ISBN:
9780079039897
Author:
Carter
Publisher:
McGraw Hill
Big Ideas Math A Bridge To Success Algebra 1: Stu…
Algebra
ISBN:
9781680331141
Author:
HOUGHTON MIFFLIN HARCOURT
Publisher:
Houghton Mifflin Harcourt