For a linear regression problem, The actual observed y-value when x = 2 is y = 6. The least squares line is = 2x+1. The predicted value when x=2 is y = 5. Determine the value of the residual (prediction error) 1 ООО С 6 5 Cannot be determined from the information given
For a linear regression problem, The actual observed y-value when x = 2 is y = 6. The least squares line is = 2x+1. The predicted value when x=2 is y = 5. Determine the value of the residual (prediction error) 1 ООО С 6 5 Cannot be determined from the information given

Linear Algebra: A Modern Introduction
4th Edition
ISBN:9781285463247
Author:David Poole
Publisher:David Poole
Chapter7: Distance And Approximation
Section7.3: Least Squares Approximation
Problem 34EQ

Related questions
Question
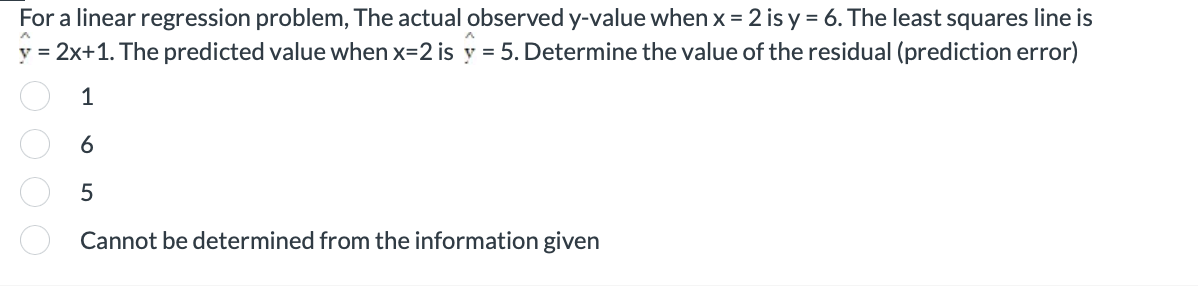
Transcribed Image Text:For a linear regression problem, The actual observed y-value when x = 2 is y = 6. The least squares line is
y = 2x+1. The predicted value when x=2 is y = 5. Determine the value of the residual (prediction error)
oooo
1
6
5
Cannot be determined from the information given
Expert Solution
This question has been solved!
Explore an expertly crafted, step-by-step solution for a thorough understanding of key concepts.

Step by step
Solved in 3 steps

Recommended textbooks for you
Linear Algebra: A Modern Introduction
Algebra
ISBN:
9781285463247
Author:
David Poole
Publisher:
Cengage Learning


Trigonometry (MindTap Course List)
Trigonometry
ISBN:
9781305652224
Author:
Charles P. McKeague, Mark D. Turner
Publisher:
Cengage Learning
Linear Algebra: A Modern Introduction
Algebra
ISBN:
9781285463247
Author:
David Poole
Publisher:
Cengage Learning
Trigonometry (MindTap Course List)
Trigonometry
ISBN:
9781305652224
Author:
Charles P. McKeague, Mark D. Turner
Publisher:
Cengage Learning

Algebra & Trigonometry with Analytic Geometry
Algebra
ISBN:
9781133382119
Author:
Swokowski
Publisher:
Cengage

Functions and Change: A Modeling Approach to Coll…
Algebra
ISBN:
9781337111348
Author:
Bruce Crauder, Benny Evans, Alan Noell
Publisher:
Cengage Learning

College Algebra
Algebra
ISBN:
9781305115545
Author:
James Stewart, Lothar Redlin, Saleem Watson
Publisher:
Cengage Learning