For a mortality study of insurance applicants in two countries, you are given: (i) Country A d, Y, Country B t, d, Y, 1 20 200 0.05 15 100 0.10 2 54 180 0.10 20 85 0.10 14 126 0.15 20 65 0.10 4 22 112 0.20 10 45 0.10 Y, is the number at risk over the period (t1,4). Deaths during the period (t-1,4) are assumed to occur at t,. (ii) 0, is the reference hazard rate over the period (t1,t,). Within a country, 0, is the same for all study participants. (iii) (iv) s'(t) is the Product-Limit estimate of S(t) based on the data for all study participants. s*(t) is the Product-Limit estimate of S(t) based on the data for study participants in Country B. (v) Determine s"(4) – s"(4) . (A) 0.06 (B) 0.07 (C) 0.08 (D) 0.09
For a mortality study of insurance applicants in two countries, you are given: (i) Country A d, Y, Country B t, d, Y, 1 20 200 0.05 15 100 0.10 2 54 180 0.10 20 85 0.10 14 126 0.15 20 65 0.10 4 22 112 0.20 10 45 0.10 Y, is the number at risk over the period (t1,4). Deaths during the period (t-1,4) are assumed to occur at t,. (ii) 0, is the reference hazard rate over the period (t1,t,). Within a country, 0, is the same for all study participants. (iii) (iv) s'(t) is the Product-Limit estimate of S(t) based on the data for all study participants. s*(t) is the Product-Limit estimate of S(t) based on the data for study participants in Country B. (v) Determine s"(4) – s"(4) . (A) 0.06 (B) 0.07 (C) 0.08 (D) 0.09

A First Course in Probability (10th Edition)
10th Edition
ISBN:9780134753119
Author:Sheldon Ross
Publisher:Sheldon Ross
Chapter1: Combinatorial Analysis
Section: Chapter Questions
Problem 1.1P: a. How many different 7-place license plates are possible if the first 2 places are for letters and...

Related questions
Question
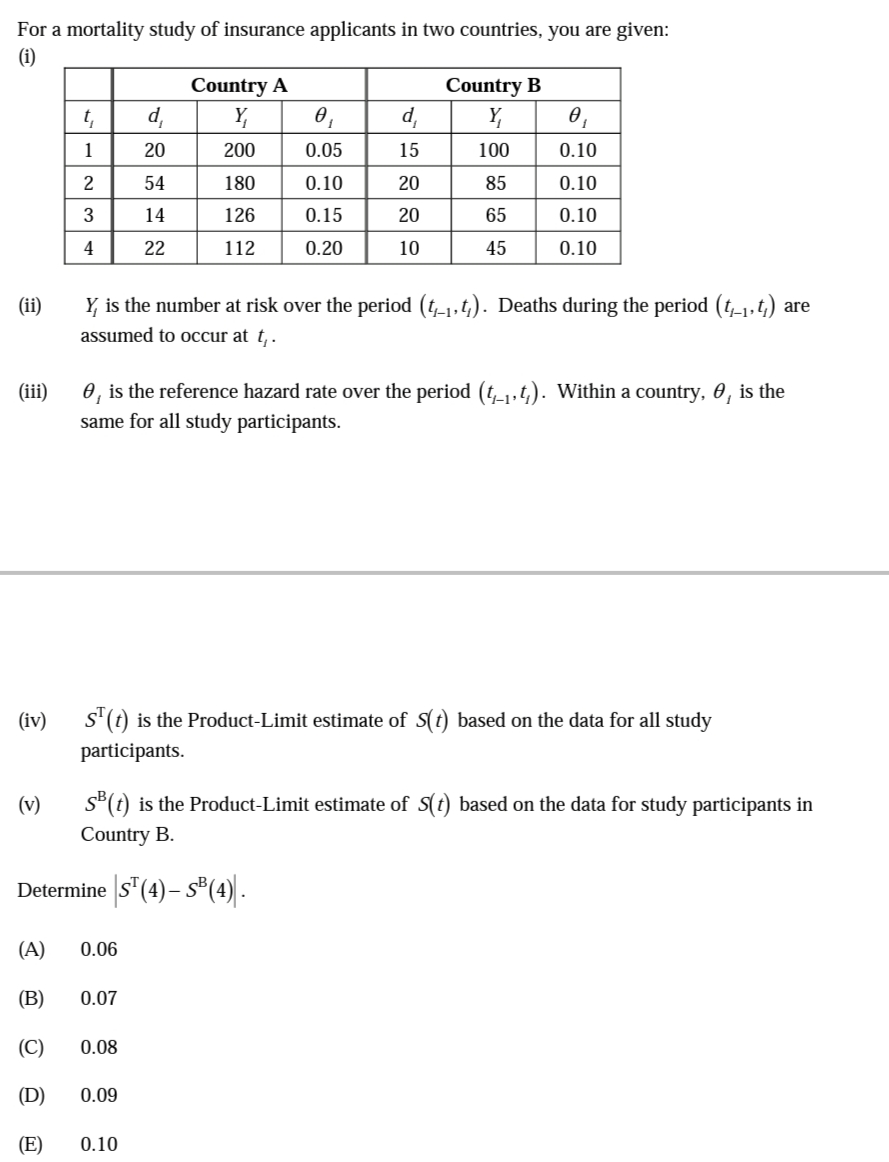
Transcribed Image Text:For a mortality study of insurance applicants in two countries, you are given:
(1)
Country A
d,
Y,
Country B
t,
d,
Y,
0,
1
20
200
0.05
15
100
0.10
54
180
0.10
20
85
0.10
14
126
0.15
20
65
0.10
4
22
112
0.20
10
45
0.10
Y, is the number at risk over the period (t1,t,). Deaths during the period (t-1,t4) are
assumed to occur at t,.
(ii)
(iii)
0, is the reference hazard rate over the period (t1,t,). Within a country, 0, is the
same for all study participants.
(iv)
s'(t) is the Product-Limit estimate of S(t) based on the data for all study
participants.
s*(t) is the Product-Limit estimate of S(t) based on the data for study participants in
Country B.
(v)
Determine s"(4)– s*(4) .
(A)
0.06
(B)
0.07
(C)
0.08
(D)
0.09
(E)
0.10
Expert Solution
This question has been solved!
Explore an expertly crafted, step-by-step solution for a thorough understanding of key concepts.

This is a popular solution!

Trending now
This is a popular solution!

Step by step
Solved in 2 steps with 2 images

Recommended textbooks for you
A First Course in Probability (10th Edition)
Probability
ISBN:
9780134753119
Author:
Sheldon Ross
Publisher:
PEARSON

A First Course in Probability (10th Edition)
Probability
ISBN:
9780134753119
Author:
Sheldon Ross
Publisher:
PEARSON