For a standard normal random variable Z, use Table 4 of the Appendix to find a number zo such that d) P(Z ≥ zo ) = 0.617 e) P(-zo ≤ Z ≤ zo ) = 0.90 f) P(-zo ≤ Z ≤ zo ) = 0.95
For a standard normal random variable Z, use Table 4 of the Appendix to find a number zo such that d) P(Z ≥ zo ) = 0.617 e) P(-zo ≤ Z ≤ zo ) = 0.90 f) P(-zo ≤ Z ≤ zo ) = 0.95

Mathematics For Machine Technology
8th Edition
ISBN:9781337798310
Author:Peterson, John.
Publisher:Peterson, John.
Chapter30: Customary And Metric Steel Rules
Section: Chapter Questions
Problem 18A

Related questions
Question
For a standard normal random variable Z, use Table 4 of the Appendix to find a number zo such that
d) P(Z ≥ zo ) = 0.617
e) P(-zo ≤ Z ≤ zo ) = 0.90
f) P(-zo ≤ Z ≤ zo ) = 0.95
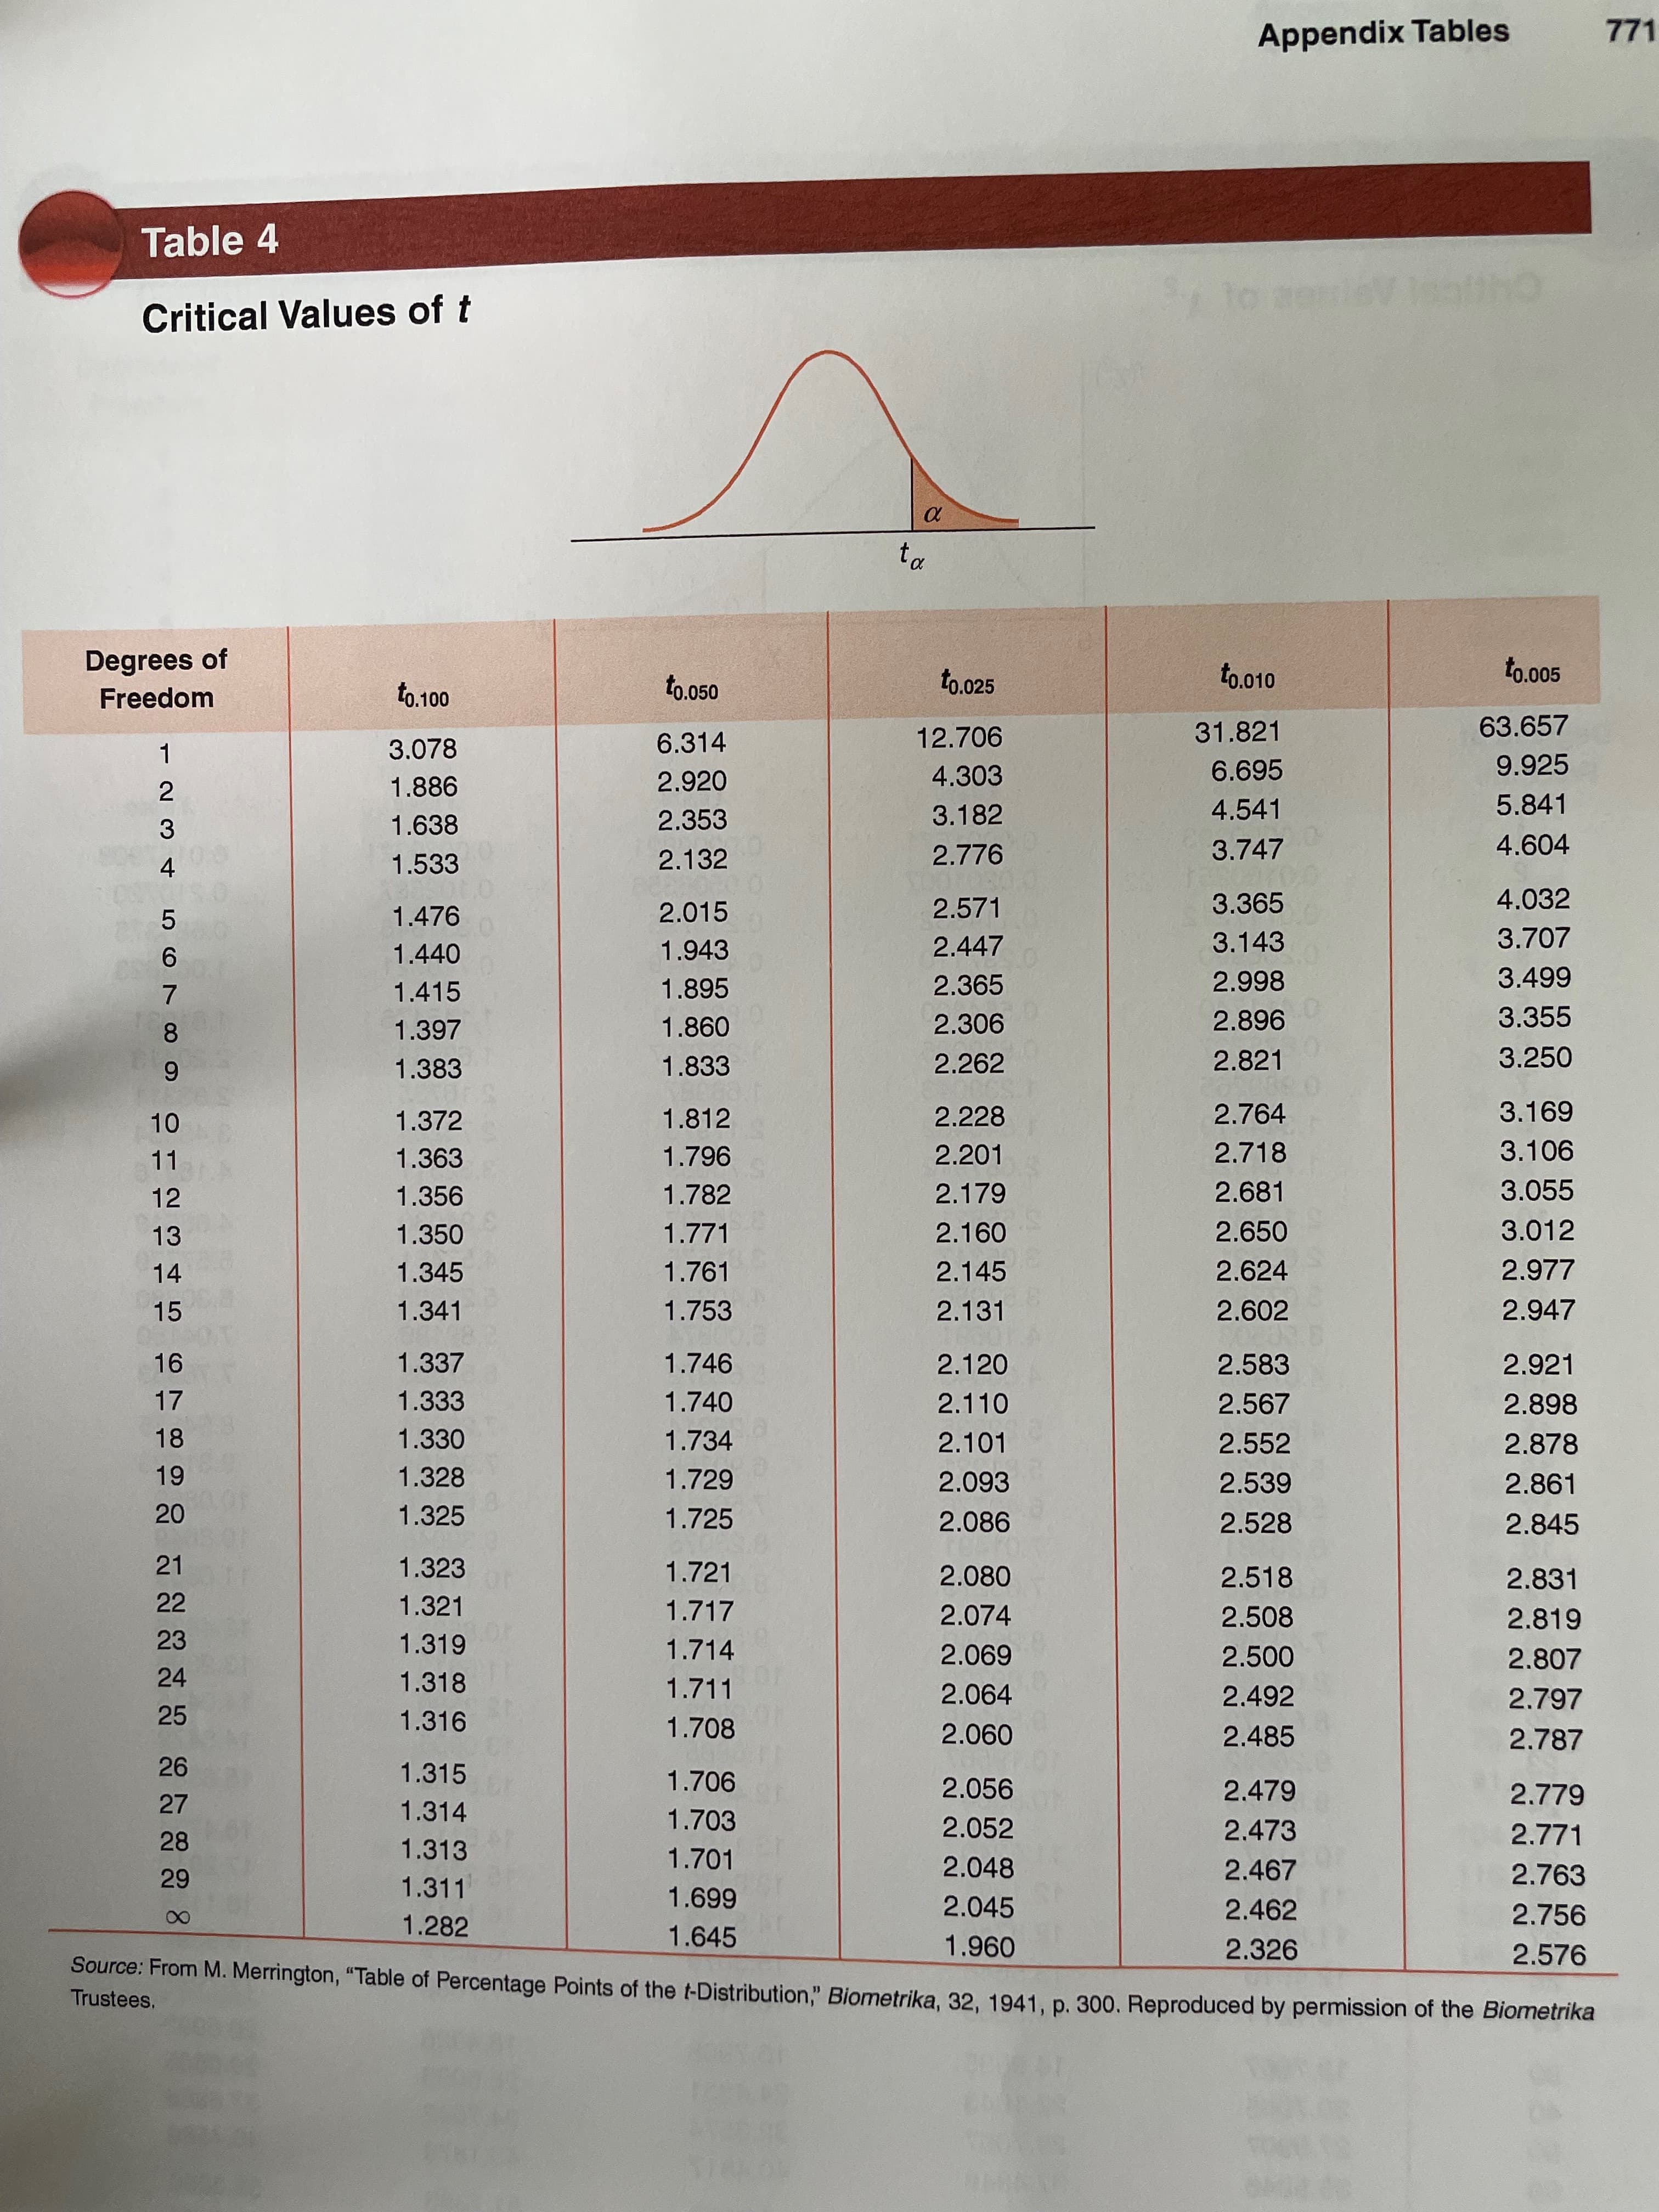
Transcribed Image Text:Appendix Tables
771
Table 4
Critical Values of t
Degrees of
Freedom
to.050
to.025
to.010
to.005
to.100
12.706
31.821
63.657
3.078
6.314
4.303
6.695
9.925
1.886
2.920
2.
3
3.182
4.541
5.841
1.638
2.353
2.132
2.776
3.747
4.604
1.533
4.
2.015
2.571
3.365
4.032
1.476
5.
3.143
3.707
1.440
1.943
2.447
66
3.355
1.415
1.895
2.365
2.998
7.
968
2.821
1.397
1.860
2.306
8.
3.250
1.383
1.833
2.262
69
3.106
1.372
1.812
2.228
2.764
2.718
96
1.782
11
1.363
2.201
12
1.356
2.179
2.681
3.055
13
1.350
1.771
2.650
3.012
14
1.345
1.761
2.145
2.624
2.977
15
1.341
1.753
2.131
2.602
2.947
1.337
1.746
2.120
2.583
2.921
17
1.333
1.740
2.110
2.567
2.898
18
1.330
1.734
2.101
2.552
2.878
1.328
1.729
2.093
2.539
2.861
1.325
1.725
2.086
2.528
2.845
20
21
1.323
1.721
2.080
2.518
2.831
22
1.321
1.717
2.074
2.508
2.819
23
1.319
1.714
690
2.064
2.500
2.807
24
1.318
1.711
2.492
2.797
25
1.316
1.708
09
2.056
2.485
2.787
1.315
2.479
2.779
27
1.314
1.703
15 90
2.052
2.473
2.771
28
1.313
1.701
2.048
2.467
2.763
1.311
669
1.645
2.045
2.462
2.756
1.282
2.326
2.576
Source: From M. Merrington, "Table of Percentage Points of the t-Distribution." Biometrika, 32, 1941. p. 300, Reproduced by permission of the Biometrika
096
Trustees,
Expert Solution
This question has been solved!
Explore an expertly crafted, step-by-step solution for a thorough understanding of key concepts.

This is a popular solution!

Trending now
This is a popular solution!

Step by step
Solved in 2 steps with 1 images

Recommended textbooks for you
Mathematics For Machine Technology
Advanced Math
ISBN:
9781337798310
Author:
Peterson, John.
Publisher:
Cengage Learning,
Mathematics For Machine Technology
Advanced Math
ISBN:
9781337798310
Author:
Peterson, John.
Publisher:
Cengage Learning,