For each of the following situation, write the null hypothesis (?") and the alternative hypothesis (? ) in both sentence and symbolic form. The Survey of Study Habits and Attitudes (SSHA) is a psychological test that measures students’ attitude toward school. Scores range from 0 (worse) to 200 (best). The mean score for university students from a group of Caribbean countries is 120. A teacher suspects that older students have better attitudes toward school. She gives the SSHA to 30 university students who are at least 25 years old. The national Centre for health Statistics in Canada reports that the mean systolic blood pressure for males 35 to 44 years of age is 128mmHg. The medical director of a large company looks at the medical record for 100 executives in this age group and finds that the mean systolic blood pressure in this sample is 126.4mmHg. The medical director wants to use this information to find out if this is evidence that the company’s executives have a different blood pressure from the general Canadian Population.


-
For each of the following situation, write the null hypothesis (?") and the alternative hypothesis (? ) in both sentence and symbolic form.
-
The Survey of Study Habits and Attitudes (SSHA) is a psychological test that measures students’ attitude toward school. Scores
range from 0 (worse) to 200 (best). Themean score for university students from a group of Caribbean countries is 120. A teacher suspects that older students have better attitudes toward school. She gives the SSHA to 30 university students who are at least 25 years old. -
The national Centre for health Statistics in Canada reports that the mean systolic blood pressure for males 35 to 44 years of age is 128mmHg. The medical director of a large company looks at the medical record for 100 executives in this age group and finds that the mean systolic blood pressure in this sample is 126.4mmHg. The medical director wants to use this information to find out if this is evidence that the company’s executives have a different blood pressure from the general Canadian Population.
-
a)
Null Hypothesis: - The mean score for university students from a group of Caribbean countries is 120.
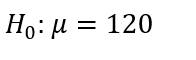
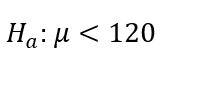
Alternative Hypothesis: - The mean score for university students from a group of Caribbean countries is less than 120.

Step by step
Solved in 2 steps with 4 images


