For each of the scenarios given below, choose the most appropriate method for analyzing the data. Unless otherwise stated, each question assumes a random sample of size 216 is used. Note that the same method may be chosen in more than one question, and some methods may not be chosen at all (a) Can you run faster after eating chocolate Easter eggs? A random sample of Ontario teenagers was selected. Each ran 50 metres and the time it took each person to run that distance was recorded. The next day each person ate 5 chocolate eggs and ran 50 metres after finishing the eggs. The time it took each person to run the distance was recorded. O A. Hypothesis test for the mean O B. Hypothesis test for paired data OC. Hypothesis test for difference in means (independent populations) OD. Confidence interval for the mean OE. Method not listed (b) Does the percentage of kids who leave a carrot for the Easter Bunny differ between Nova Scotia and Newfoundland? A random sample of Nova Scotia kids and a random sample of Newfoundland kids were chosen and each was asked if they left a carrot for the Easter Bunny. O A. Confidence interval for the mean O B. Hypothesis test for the mean OC. Method not listed OD. Hypothesis test for paired data OE. Hypothesis test for difference in means (independent populations) (c) Do people run faster after eating chocolate eggs? A random sample of Halifax teenagers were timed in 50 metre race, and a random sample of Truro teenagers were timed in a 50 metre race after they ate 6 chocolate eggs. O A. Hypothesis test for difference in means (independent populations) O B. Hypothesis test for the mean OC. Confidence interval for the mean OD. Method not listed O E. Hypothesis test for paired data
For each of the scenarios given below, choose the most appropriate method for analyzing the data. Unless otherwise stated, each question assumes a random sample of size 216 is used. Note that the same method may be chosen in more than one question, and some methods may not be chosen at all (a) Can you run faster after eating chocolate Easter eggs? A random sample of Ontario teenagers was selected. Each ran 50 metres and the time it took each person to run that distance was recorded. The next day each person ate 5 chocolate eggs and ran 50 metres after finishing the eggs. The time it took each person to run the distance was recorded. O A. Hypothesis test for the mean O B. Hypothesis test for paired data OC. Hypothesis test for difference in means (independent populations) OD. Confidence interval for the mean OE. Method not listed (b) Does the percentage of kids who leave a carrot for the Easter Bunny differ between Nova Scotia and Newfoundland? A random sample of Nova Scotia kids and a random sample of Newfoundland kids were chosen and each was asked if they left a carrot for the Easter Bunny. O A. Confidence interval for the mean O B. Hypothesis test for the mean OC. Method not listed OD. Hypothesis test for paired data OE. Hypothesis test for difference in means (independent populations) (c) Do people run faster after eating chocolate eggs? A random sample of Halifax teenagers were timed in 50 metre race, and a random sample of Truro teenagers were timed in a 50 metre race after they ate 6 chocolate eggs. O A. Hypothesis test for difference in means (independent populations) O B. Hypothesis test for the mean OC. Confidence interval for the mean OD. Method not listed O E. Hypothesis test for paired data

Glencoe Algebra 1, Student Edition, 9780079039897, 0079039898, 2018
18th Edition
ISBN:9780079039897
Author:Carter
Publisher:Carter
Chapter10: Statistics
Section10.5: Comparing Sets Of Data
Problem 14PPS

Related questions
Question
D1)
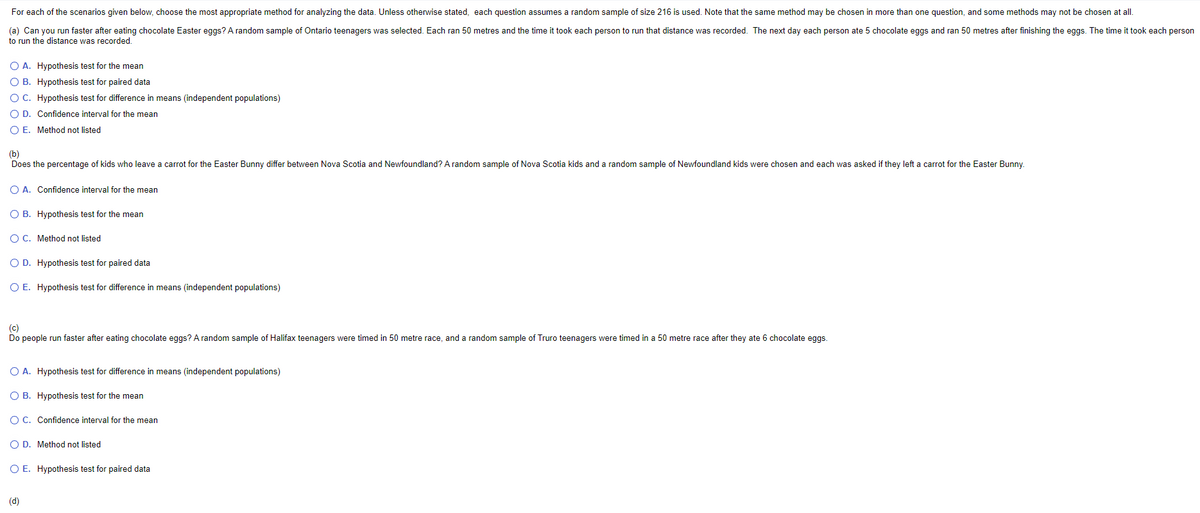
Transcribed Image Text:For each of the scenarios given below, choose the most appropriate method for analyzing the data. Unless otherwise stated, each question assumes a random sample of size 216 is used. Note that the same method may be chosen in more than one question, and some methods may not be chosen at all.
(a) Can you run faster after eating chocolate Easter eggs? A random sample of Ontario teenagers was selected. Each ran 50 metres and the time it took each person to run that distance was recorded. The next day each person ate 5 chocolate eggs and ran 50 metres after finishing the eggs. The time it took each person
to run the distance was recorded.
O A. Hypothesis test for the mean
O B. Hypothesis test for paired data
OC. Hypothesis test for difference in means (independent populations)
O D. Confidence interval for the mean
O E. Method not listed
(b)
Does the percentage of kids who leave
carrot for the Easter Bunny differ between Nova Scotia and Newfoundland? A random sample of Nova Scotia kids and a random sample of Newfoundland kids were chosen and each was asked if they left a carrot for the Easter Bunny.
O A. Confidence interval for the mean
O B. Hypothesis test for the mean
O C. Method not listed
O D. Hypothesis test for paired data
O E. Hypothesis test for difference in means (independent populations)
(c)
Do people run faster after eating chocolate eggs? A random sample of Halifax teenagers were timed in 50 metre race, and a random sample of Truro teenagers were timed in a 50 metre race after they ate 6 chocolate eggs.
O A. Hypothesis test for difference in means (independent populations)
O B. Hypothesis test for the mean
O C. Confidence interval for the mean
O D. Method not listed
O E. Hypothesis test for paired data
(d)
Expert Solution
This question has been solved!
Explore an expertly crafted, step-by-step solution for a thorough understanding of key concepts.

This is a popular solution!

Trending now
This is a popular solution!

Step by step
Solved in 4 steps

Recommended textbooks for you
Glencoe Algebra 1, Student Edition, 9780079039897…
Algebra
ISBN:
9780079039897
Author:
Carter
Publisher:
McGraw Hill
Glencoe Algebra 1, Student Edition, 9780079039897…
Algebra
ISBN:
9780079039897
Author:
Carter
Publisher:
McGraw Hill