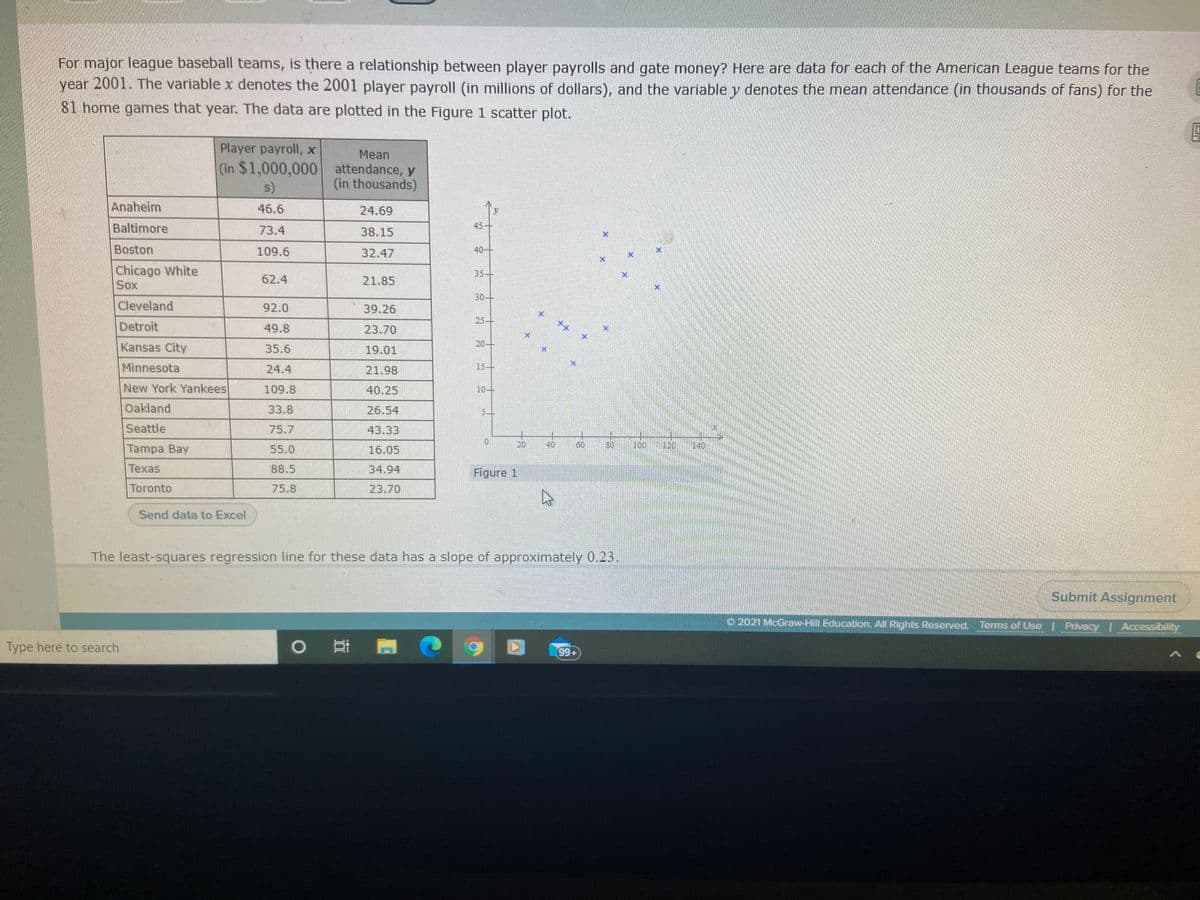
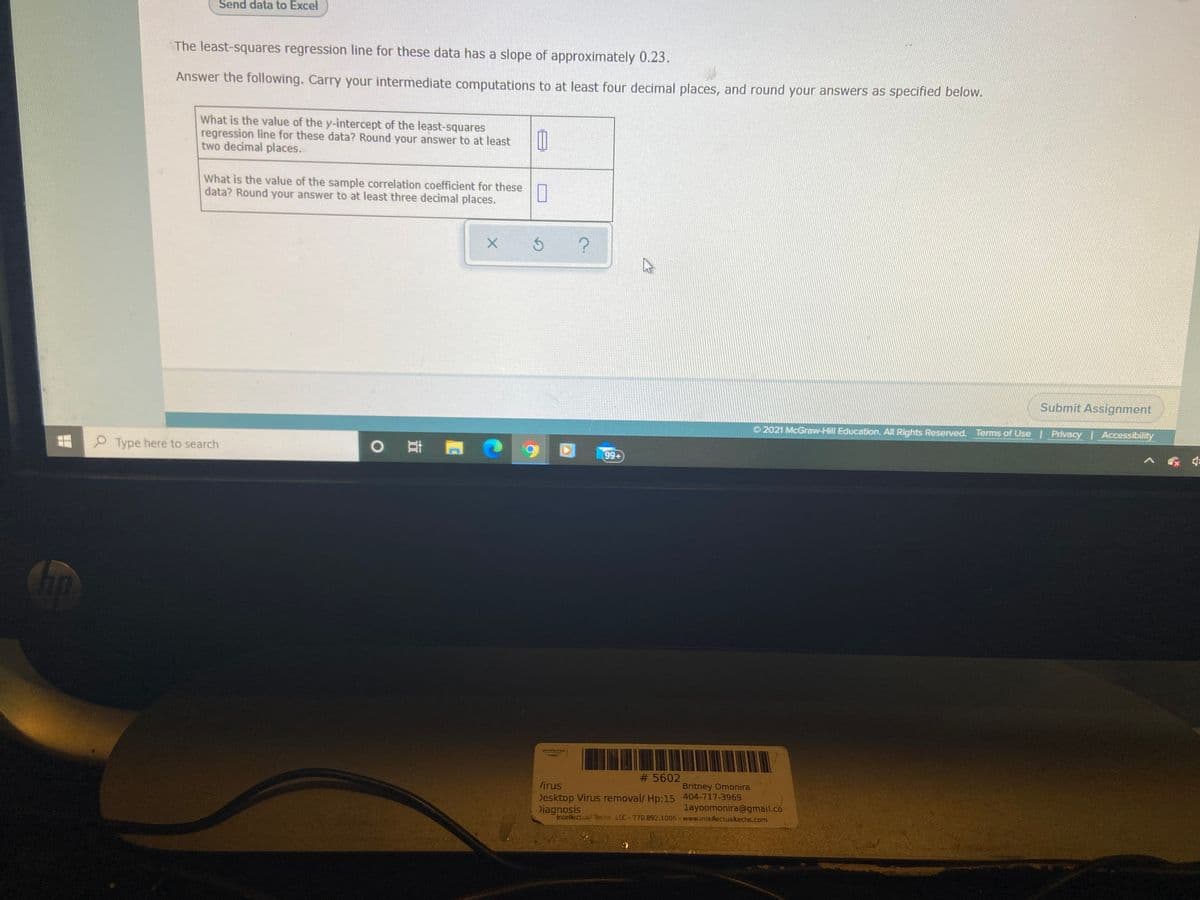
For major league baseball teams, is there a relationship between player payrolls and gate money? Here are data for each of the American League teams for the year 2001. The variable x denotes the 2001 player payroll (in millions of dollars), and the variable y denotes the mean attendance (in thousands of fans) for the 81 home games that year. The data are plotted in the Figure 1 scatter plot. Player payroll, x Mean (in $1,000,000 attendance, y (in thousands) s) Anaheim Baltimore 46.6 24.69 45+ 73.4 38.15 Boston 109.6 32.47 40- Chicago White Sox 35+ 62.4 21.85 304 Cleveland 92.0 39.26 Detroit 49.8 25- 23.70 Kansas City 35.6 19.01 20- Minnesota 24.4 21.98 15- New York Yankees 109.8 40.25 10- Oakland 33.8 26.54 5- Seattle 75.7 43.33 Tampa Bay 55.0 16.05 20 40 60 30 100120 140 Texas 88.5 34.94 Figure 1 Toronto 75.8 23.70 Send data to Excel The least-squares regression line for these data has a slope of approximately 0.23. Submit Assignment


Inverse Normal Distribution
The method used for finding the corresponding z-critical value in a normal distribution using the known probability is said to be an inverse normal distribution. The inverse normal distribution is a continuous probability distribution with a family of two parameters.
Mean, Median, Mode
It is a descriptive summary of a data set. It can be defined by using some of the measures. The central tendencies do not provide information regarding individual data from the dataset. However, they give a summary of the data set. The central tendency or measure of central tendency is a central or typical value for a probability distribution.
Z-Scores
A z-score is a unit of measurement used in statistics to describe the position of a raw score in terms of its distance from the mean, measured with reference to standard deviation from the mean. Z-scores are useful in statistics because they allow comparison between two scores that belong to different normal distributions.


Trending now
This is a popular solution!

Step by step
Solved in 2 steps with 1 images


