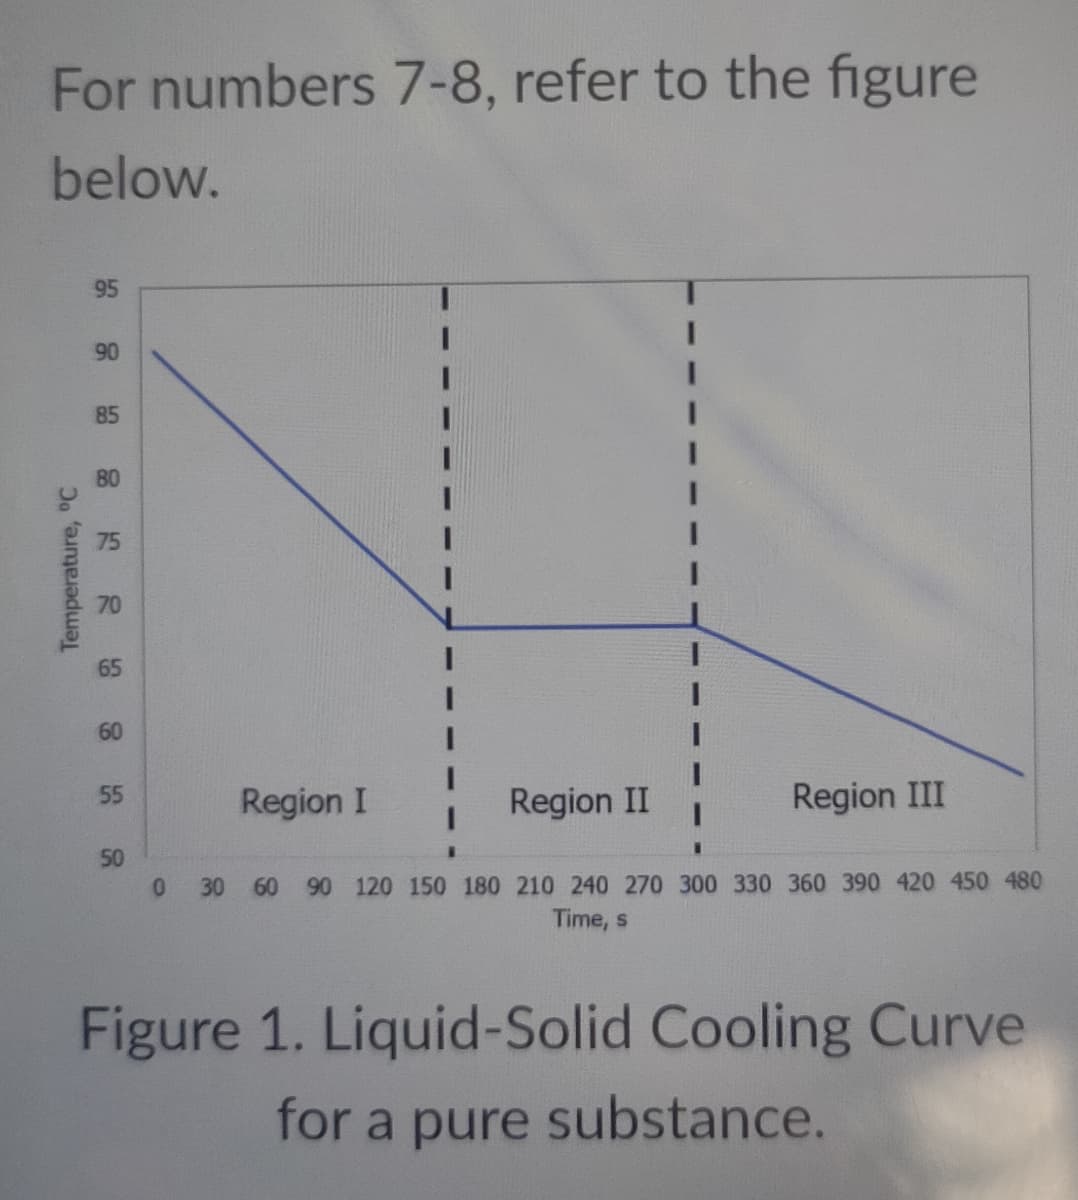
For numbers 7-8, refer to the figure below. 95 90 85 80 75 70 65 60 55 Region I Region II Region III 50 0 30 60 90 120 150 180 210 240 270 300 330 360 390 420 450 480 Time, s Figure 1. Liquid-Solid Cooling Curve for a pure substance. Temperature, °C
For numbers 7-8, refer to the figure below. 95 90 85 80 75 70 65 60 55 Region I Region II Region III 50 0 30 60 90 120 150 180 210 240 270 300 330 360 390 420 450 480 Time, s Figure 1. Liquid-Solid Cooling Curve for a pure substance. Temperature, °C

Macroscale and Microscale Organic Experiments
7th Edition
ISBN:9781305577190
Author:Kenneth L. Williamson, Katherine M. Masters
Publisher:Kenneth L. Williamson, Katherine M. Masters
Chapter5: Distillation
Section: Chapter Questions
Problem 13Q

Related questions
Question
7. What happens to the average kinetic energy of the substance in Region I of the cooling curve?
A. Decreases
B. Increases
C. Remains Constant
D. Cannot be determined from the givenfigure
8. What should be the expected appearance of the substance in Region III of the cooling curve?
A. Solid
B.Liquid
C. Solid-Liquid
D. Cannot be determined from the given figure
Transcribed Image Text:For numbers 7-8, refer to the figure
below.
95
90
85
75
70
65
60
55
Region I
Region II
Region III
50
0 30 60 90 120 150 180 210 240 270 300 330 360 390 420 450 480
Time, s
Figure 1. Liquid-Solid Cooling Curve
for a pure substance.
Temperature, °C
Expert Solution
This question has been solved!
Explore an expertly crafted, step-by-step solution for a thorough understanding of key concepts.

Step by step
Solved in 3 steps

Knowledge Booster


Learn more about
Need a deep-dive on the concept behind this application? Look no further. Learn more about this topic, chemistry and related others by exploring similar questions and additional content below.Recommended textbooks for you
Macroscale and Microscale Organic Experiments
Chemistry
ISBN:
9781305577190
Author:
Kenneth L. Williamson, Katherine M. Masters
Publisher:
Brooks Cole
Macroscale and Microscale Organic Experiments
Chemistry
ISBN:
9781305577190
Author:
Kenneth L. Williamson, Katherine M. Masters
Publisher:
Brooks Cole