For the current year, appraisal costs are what percentage of sales? 3.333% 0.833% 0.500% 0.875% If quality costs had been reduced to 2.5 percent of sales in the current year, profits would have increased by
For the current year, appraisal costs are what percentage of sales? 3.333% 0.833% 0.500% 0.875% If quality costs had been reduced to 2.5 percent of sales in the current year, profits would have increased by

Cornerstones of Cost Management (Cornerstones Series)
4th Edition
ISBN:9781305970663
Author:Don R. Hansen, Maryanne M. Mowen
Publisher:Don R. Hansen, Maryanne M. Mowen
Chapter14: Quality And Environmental Cost Management
Section: Chapter Questions
Problem 21E: At the end of 20x5, Bing Pharmaceuticals began to implement an environmental quality management...

Related questions
Question
For the current year, prevention costs are what percentage of sales?
For the current year, appraisal costs are what percentage of sales?
- 3.333%
- 0.833%
- 0.500%
- 0.875%
If quality costs had been reduced to 2.5 percent of sales in the current year, profits would have increased by
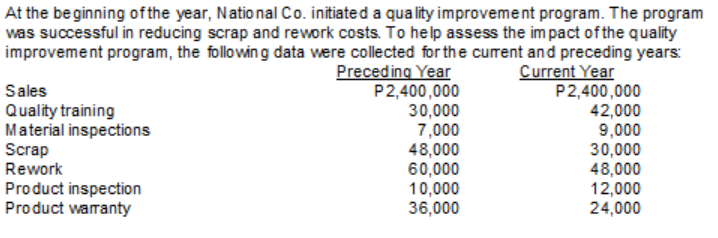
Transcribed Image Text:At the beginning ofthe year, National Co. initiated a quality improvement program. The program
was successful in reducing scrap and rework costs. To help assess the im pact of the quality
improvement program, the following data were collected for the curent and preceding years:
Preceding Year
P2,400,000
30,000
7,000
48,000
60,000
10,000
36,000
Current Year
P2,400,000
42,000
9,000
30,000
48,000
12,000
24,000
Sales
Quality training
Material inspections
Scrap
Rework
Product inspection
Product waranty
Expert Solution
This question has been solved!
Explore an expertly crafted, step-by-step solution for a thorough understanding of key concepts.

Step by step
Solved in 3 steps

Knowledge Booster


Learn more about
Need a deep-dive on the concept behind this application? Look no further. Learn more about this topic, accounting and related others by exploring similar questions and additional content below.Recommended textbooks for you
Cornerstones of Cost Management (Cornerstones Ser…
Accounting
ISBN:
9781305970663
Author:
Don R. Hansen, Maryanne M. Mowen
Publisher:
Cengage Learning

Managerial Accounting
Accounting
ISBN:
9781337912020
Author:
Carl Warren, Ph.d. Cma William B. Tayler
Publisher:
South-Western College Pub

Financial And Managerial Accounting
Accounting
ISBN:
9781337902663
Author:
WARREN, Carl S.
Publisher:
Cengage Learning,
Cornerstones of Cost Management (Cornerstones Ser…
Accounting
ISBN:
9781305970663
Author:
Don R. Hansen, Maryanne M. Mowen
Publisher:
Cengage Learning
Managerial Accounting
Accounting
ISBN:
9781337912020
Author:
Carl Warren, Ph.d. Cma William B. Tayler
Publisher:
South-Western College Pub
Financial And Managerial Accounting
Accounting
ISBN:
9781337902663
Author:
WARREN, Carl S.
Publisher:
Cengage Learning,

Managerial Accounting: The Cornerstone of Busines…
Accounting
ISBN:
9781337115773
Author:
Maryanne M. Mowen, Don R. Hansen, Dan L. Heitger
Publisher:
Cengage Learning