For the data and sample regression equation shown below, do the following. a. Decide, at the 10% significance level, whether the data provide sufficient evidence to conclude that x is useful for predicting y. b. Find a 90% confidence interval for the slope of the population regression line. 24 3 10 4 1 3-3 y=-1.5 +1.1x, x₁ = 10, Σx;² = 30, b₁ = 1.1, and so = 3.3690 x y a. What are the hypotheses for the test? O A. Ho: B₁ = 0 and H₂: B₁ #0 O B. Ho: B₁ = 0 and H₂: B₁ >0 O C. Ho: B₁ #0 and H₂: B₁ = 0 O D. Ho: B₁ = 0 and H₂: B₁ <0 What is the test statistic? t= (Round to two decimal places as needed.) Find the P-value. P-value = (Round to three decimal places as needed.)
For the data and sample regression equation shown below, do the following. a. Decide, at the 10% significance level, whether the data provide sufficient evidence to conclude that x is useful for predicting y. b. Find a 90% confidence interval for the slope of the population regression line. 24 3 10 4 1 3-3 y=-1.5 +1.1x, x₁ = 10, Σx;² = 30, b₁ = 1.1, and so = 3.3690 x y a. What are the hypotheses for the test? O A. Ho: B₁ = 0 and H₂: B₁ #0 O B. Ho: B₁ = 0 and H₂: B₁ >0 O C. Ho: B₁ #0 and H₂: B₁ = 0 O D. Ho: B₁ = 0 and H₂: B₁ <0 What is the test statistic? t= (Round to two decimal places as needed.) Find the P-value. P-value = (Round to three decimal places as needed.)

Glencoe Algebra 1, Student Edition, 9780079039897, 0079039898, 2018
18th Edition
ISBN:9780079039897
Author:Carter
Publisher:Carter
Chapter4: Equations Of Linear Functions
Section4.6: Regression And Median-fit Lines
Problem 4GP

Related questions
Question
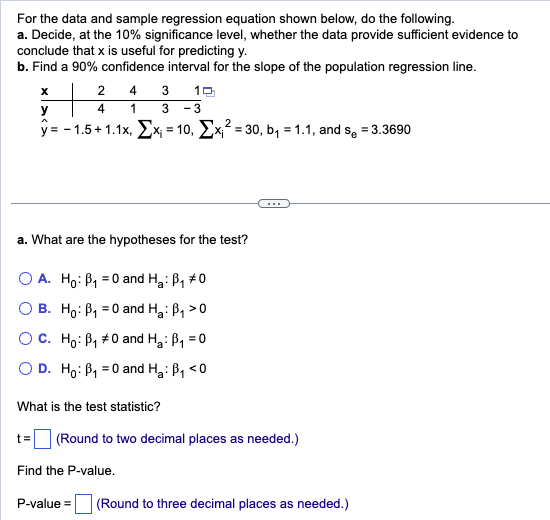
Transcribed Image Text:For the data and sample regression equation shown below, do the following.
a. Decide, at the 10% significance level, whether the data provide sufficient evidence to
conclude that x is useful for predicting y.
b. Find a 90% confidence interval for the slope of the population regression line.
4 3 10
1
3 -3
2
y=-1.5 +1.1x, x₁ = 10, Σx₁²=30, b₁ = 1.1, and se = 3.3690
X
y
2
4
a. What are the hypotheses for the test?
O A. Ho: B₁ = 0 and H₂: B₁ #0
OB. Ho: B₁0 and H₂: B₁ >0
O C.
Ho: B₁ #0 and H₂: B₁ = 0
O D. Ho: P₁ = 0 and H₂: B₁ <0
What is the test statistic?
(Round to two decimal places as needed.)
Find the P-value.
P-value= (Round to three decimal places as needed.)
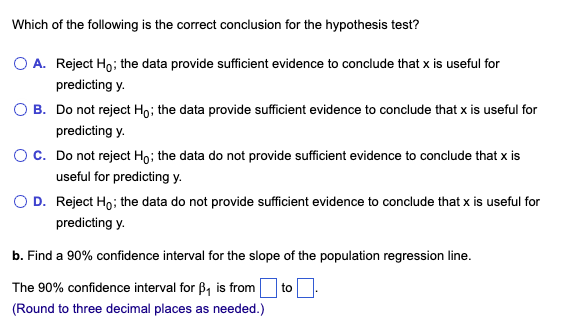
Transcribed Image Text:Which of the following is the correct conclusion for the hypothesis test?
O A. Reject Ho; the data provide sufficient evidence to conclude that x is useful for
predicting y.
O B. Do not reject Ho; the data provide sufficient evidence to conclude that x is useful for
predicting y.
O C. Do not reject Ho; the data do not provide sufficient evidence to conclude that x is
useful for predicting y.
O D. Reject Ho; the data do not provide sufficient evidence to conclude that x is useful for
predicting y.
b. Find a 90% confidence interval for the slope of the population regression line.
The 90% confidence interval for B₁ is from to
(Round to three decimal places as needed.)
Expert Solution
This question has been solved!
Explore an expertly crafted, step-by-step solution for a thorough understanding of key concepts.

This is a popular solution!

Trending now
This is a popular solution!

Step by step
Solved in 4 steps

Recommended textbooks for you
Glencoe Algebra 1, Student Edition, 9780079039897…
Algebra
ISBN:
9780079039897
Author:
Carter
Publisher:
McGraw Hill
Glencoe Algebra 1, Student Edition, 9780079039897…
Algebra
ISBN:
9780079039897
Author:
Carter
Publisher:
McGraw Hill