The mean of the frequency distribution is degrees. (Round to the nearest tenth as needed)
Q: A null and alternative hypothesis are given. Determine whether the hypothe or two-tailed. Ho: pz 0.8…
A: The given hypothesis is H0: p≥0.8Ha: p<0.8
Q: a) Draw a scatter diagram for the above data and interpret the relationship between the two…
A: Followings are the Explanation of the Question a) Use the Excel and draw the Scatterplot Followings…
Q: The random variable X has a uniform distribution with values between 11 and 21. What is the mean…
A:
Q: What benefit does conducting an experiment to prove that free coffee causes more frequent shoe…
A: The objective is to interpret the benefit, for the experiment that tries to interpret a cause and…
Q: Find the critical value(s) and rejection region(s) for the indicated t-test, level of significance…
A: GivenTest is two-tailed testsignificance level(α)=0.02sample size(n)=14
Q: Answer the following to summarize the test of the hypothesis that there is no relationship between…
A: Chi square is the type of parametric test. There are three types of chi square test. It is based on…
Q: At least 26% of workers indicate that they are mildly dissatisfied with their job. Express the null…
A:
Q: 9.19 Medical School Undergraduate GPAS (Example 60) The undergraduate grade point average (GPA) for…
A:
Q: The ages (in years) of a random sample of shoppers at a gaming store are shown. Determine the range,…
A: Solution
Q: Choose the correct answer below. A. r=-0.922 represents a stronger correlation because |-0.922|>10.…
A: Two correlation coefficients are given. r=0.797 r=-0.922
Q: 3 Salaries of college and non-college graduates were compared. Results are shown below: Educ Level…
A: Chi square test are used to determine the independency between the variable. Chi square test use…
Q: Problem 3 A bowl contains 24 balls of various colors: color balls in bowl color Consider drawing a…
A: Given that: Total number of balls, N=24 Color baby blue fuschia beige black Balls in…
Q: Given in the table are the BMI statistics for random samples of men and women. Assume that the two…
A: It is given that the two samples are independent simple random samples selected from normally…
Q: 1 CoMpute and interpret the correlatiion coefficient for the following data: xx X 9 11 10 10 14 9 15…
A: Since you have asked multiple question, we will solve the first question for you. If you want any…
Q: A poll shows that 219 out of 509 residents in Rock County and 260 out of 519 residents in Dock…
A: Given X1=219, n1=509, X2=260, n2=519 Level of significance ɑ=0.05
Q: The researcher runs an OLS regression with five regressors and a constant on a sample of 453…
A: Solution: From the given information, sample size is 453, the number of regressors is 5, the value…
Q: Which of the following hypotheses indicates expected increases based on an independent variable?…
A: Two main kinds of hypothesis are 1.Directional hypothesis 2.Non-directional hypothesis
Q: Given are five observations for two variables, and y. Excel File: data14-25.xlsx xi Yi 0.9726 2 7…
A: The standard error is the error occur in the observation. The standard error of estimate is…
Q: The table and scatter plot show the time spent texting, x, and the time spent exercising, y, by each…
A: Regression equation usually used to predict the value. It is the equation of independent and…
Q: The 9 members of the swim team completed the following numbers of laps at today's practice:…
A: As per our guidelines we are supposed to answer only one question per post so i am solving first…
Q: One sample test For sample of protein powder, I measured the grams of protein. According to the…
A: Given: μ = 50 grams n = 25 Formula Used: Test-statistic t = X-μsn
Q: he same as the mean?
A: Length in Meters House Wives 1.0 50 1.5 48 2.0 42.00 2.5 40.00 3.0 10.00…
Q: Do males or females feel more tense or stressed out at work? A survey of employed adults conducted…
A:
Q: 4. According to this figure, in which compartment are you least likely to find a fish during an…
A: Hint: From graph the solution can find
Q: A manufacturer knows that their items have a normally distributed length, with a mean of 14.9…
A: As per Bartleby guideline expert have to answer first question only please upload other questions…
Q: The local pilots association examined records from this year's census of its members. Miguel is a…
A: Given,mean(μ)=3260standard deviation(σ)=865Miguel's flight experiance(X)=3375
Q: Responses to a survey question are broken down according to employment status and the sample results…
A: Given claim: response and employment status are independent. Null Hypothesis: H0: response and…
Q: A fair coin is tossed 8 times. What is the number of possible sequences with at least two heads and…
A: Given that the coin is fair, each toss is independent of each other. Considering each coin has the…
Q: isband and wife apply for two vacant spots in a company. If the probability of wife gettin ected and…
A:
Q: Given are five observations for two variables, and y. Excel File: data14-25.xlsx Xi Yi 2 7 The…
A: Given information: y^=7.6+0.9x x y y^ (y-y^)^2 2 7 7.6+(0.9*2)=9.4 5.76 6 18 13 25 9 9…
Q: Among drivers who have had a car crash in the last year, 210 were randomly selected and categorized…
A:
Q: mes, a sample of 27 pieces of carry- on luggage was weighed. The average weight was 36 pounds.…
A: Given that Sample size n =27 Sample mean =36 Population standard deviation =4
Q: A variable of two populations has a mean of 49 and a standard deviation of 14 for one of the…
A: Solution
Q: The test statistic of z= - 1.56 is obtained when testing the claim that p < 0.51. A) using a…
A: We have given that Test statistic (z) = -1.56 p < 0.51 (claim) Hence, it is left tailed test…
Q: 9.33 Confidence Interval Changes State whether each of the following changes would make a confidence…
A:
Q: What is the relationship between the amount of time statistics students study per week and their…
A: Hello! As you have posted more than 3 sub parts, we are answering the 3 sub-parts(d, e and f). In…
Q: Based on historical data, your manager believes that 27% of the company's orders come from…
A: Given Information: 27% of the company's orders come from first-time customers. Sample size n=157…
Q: Identify the sample space of the probability experiment and determine the number of outcomes in the…
A: Sample space: Sample space is a collection of possible outcomes in an experiment and it is…
Q: The masses, in kilograms, of group of Jessy Bragg's weight loss group are shown. 81, 79, 83, 76, 89,…
A: Mean: The mean of the given numbers, is calculated by dividing the sum of the numbers by the total…
Q: The polynomial regression model of degree r is given by Yį = B₁ + B₁X₁ + ß₂X² + ··· + ß₂X{ + U₂. (a)…
A:
Q: Consider the following set of ordered pairs. Complete parts a through 3 20 4 6 X y 2 4 4
A: c) From the part a, y^=3+0.4x SSE: x y y^ (y-y^)^2 3 4 3+(0.4*3)=4.2 0.04 1 2 3+(0.4*1)=3.4…
Q: Compute the least-squares regression equation for the given data set. Use a TI-84 calculator. Round…
A: The least square regression line is given by, ŷ = bx+a Where b=…
Q: The local pilots association examined records from this year's census of its members. Miguel is a…
A: Given that Mean = 3260 Standard deviation = 865 X = 3375
Q: If X is normally distributed with a mean of 20 and a standard deviatic of 4. If you take a sample of…
A:
Q: For the statement below, write the claim as a mathematical statement. State the null and alternative…
A:
Q: A grocery store manager did a study to look at the relationship between the amount of time (in…
A: Note: As per the guidelines only three sub parts can be answered. Kindly, repost for other subparts.…
Q: (a) State the null hypothesis Ho and the alternative hypothesis H₁. Ho: 0 H₁:0 (b) Determine the…
A: Given: Sample size, n is 8 Brand 1 Brand 2 Difference 0.43 0.43 0 0.62 0.48 0.14 0.35 0.2…
Q: 9.13 Chapter 9: Section Exercises (Example 30) Income in Maryland According to a 2018 Money magazine…
A: Given: μ = 75847 σ = 32000 n = 100 Formula Used: Z-score = X-μσn
Q: X is the Binomial Random Variable which counts the number of students who passed an exam. If the…
A:
Q: Table 1 Brand Purchasing Intention Mean N Perodua 41 4.2927 Proton 54 3.6543 Toyota 53 5.0126 Honda…
A: Descriptive statistic are used to summarize the data set. It can be measured using the central…
Section 3.1, question 6
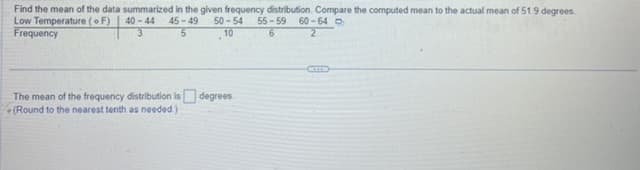
Step by step
Solved in 2 steps with 2 images