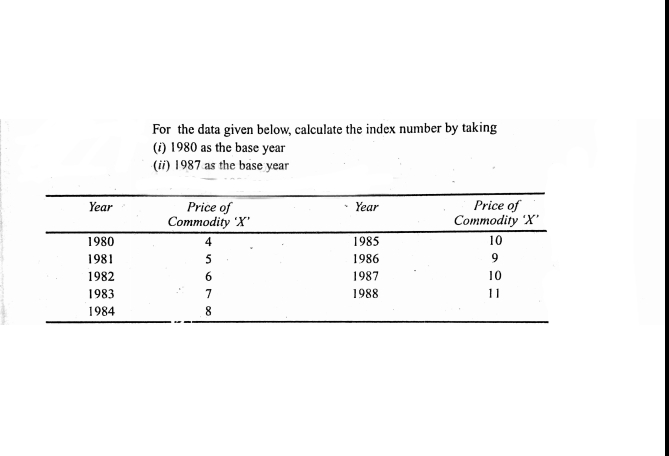
For the data given below, calculate the index number by taking (i) 1980 as the base year (ii) 1987 as the base year Price of Commodity 'X Price of Commodity 'X' 10 Year Year 1980 4 1985 1981 5 1986 1982 1987 10 1983 1988 11 1984


Q: The theory predicts the proportion of beans, in the four groups A, B, C and D should be 9:33 1. 1, I...
A:
Q: Whenever Suzan sees a bag of marbles, she grabs a handful at random. She has seen a bag containing t...
A:
Q: The cdf of a continuous RV X is given by F(x) = 0, x x 5- = 1, x 2 3 Find the pdf of X and evaluate...
A:
Q: Calculate trend values by the method of Least Square from the data given below and estimate the sale...
A:
Q: When constructing a confidence interval for the population mean, the case where the population stand...
A:
Q: An aptitude test for selecting officers in a bank was conducted on 1,000 candidates, the average sco...
A:
Q: A random survey of 600 registered voters revealed that only 39% actually voted in the last primary e...
A: Given that, A random survey of 600 registered voters revealed that only 39% actually voted in the la...
Q: Refer to the data set 3.94, 1.47, 2.06, 2.36, 3.74, 3.43, 3.78. Find the 2nd decile. A. 1.47 B. 2.06...
A: Decile is the measure which used to measure the location of the observation. It divide the data into...
Q: Evaluate the first quartile O for the following data. 54, 69, 24, 75, 77, 83, 95, 100, 35, 110 O 110...
A:
Q: For a distribution the first four moments about zero are 1, 7, 38 and 155 respectively (1) Compute t...
A: Let μi' denote the ith order raw moment. Given, μi' = 1, μ21 = 7, μ3' = 38 and μ4' = 155
Q: Given the following equation: Y 80 + 6X (origin 2010 X unit = 1 year) Change the origin to 2007 (ii)...
A:
Q: Create a frequency table for your new variable “AGE GROUP” using the following column headings: Age...
A: Given Information: Age Group Frequency 18 to 49 163 50 to 64 72 65 years or older 13 Tota...
Q: Determine the cumulative distribution function for the random variable Xwith the probability mass fu...
A:
Q: Question: A, B and C are bidding for a contract. It is believed that A has exactly half the chance t...
A: Here Given Probability of A bidding=P(A) Probability of B bidding=P(B) Probability of C bidding=P(C...
Q: 1. We want to see if there is a difference in the average delivery time of two local pizza restauran...
A: n1=n2=6,x̄1=29.1, s1=1, x̄2=26.5, s2=1.2
Q: You want to find out the maximum beer consumption of the 25% spring breakers who drink the least. Fo...
A:
Q: Let X1, X2, ..., Xn be n random variables, then (Σ4Χ) - Σ V() + 2 Σ Σ 44 E a; X;) i= 1 a; aj i =1 j=...
A:
Q: Data X Data Y Data Z 25 25 25 Time left 0:4- 20 20 20 15 15 10 10 10 5 5 5 1 2 3 4 5 6 7 8 9 10 1 2 ...
A: The standard deviations and median are to be inferred from the plotted graphs, through visual inspec...
Q: Whenever Suzan sees a bag of marbles, she grabs a handful at random. She has seen a bag containing f...
A:
Q: At how many pitchers of excessive beer consumption would a spring breaker be considered an outlier? ...
A:
Q: 3. Robin Universal Corporation is planning to invest in a security that has several possible rates o...
A: Let X be the random variable having probability mass function is, Return (X) probability P(X) ...
Q: An aptitude test for selecting officers in a bank was conducted on 1,000 candidates, the average sco...
A:
Q: The number of telephone calls that arrive at a phone exchange is often modelled as a Poisson random ...
A: Given The data is as follows: Let X be the event of getting calls. X~Pλ=8
Q: If a quarterback is below average in height, would you expect him to be above average or below avera...
A: coefficient correlation : In a correlation analysis, the correlation} could be a specific statistic ...
Q: Find the variance of the given table in the attached photo
A:
Q: 1. On a final examination in Mathematics, the mean was 76 and the standard deviation was 5. Determin...
A: Since you have asked multiple questions, we will solve the first question for you. If you want any s...
Q: 1. Three Hundred digits were chosen at random from a set of tables. The frequencies of the digits we...
A:
Q: Determine whether the following statements are true or false. Provide justifications afterwards. For...
A: Central tendency : central tendency is very helpful.It tells U.S.A. however traditional or 'average'...
Q: Build a frequency distribution table for the following data. 3, 5, 7, 5, 8, 4, 11, 1, 15, 5, 12, 9, ...
A: Given data is 3,5,7,5,8,4,11,1,15,5,12,9,2,5,14
Q: Fit a straight line by the method of least squares to the data given below : Year 2010 2011 2012 201...
A: The given straight line to fit the sales (i.e., the variable Y ) based on a given year (i.e, variabl...
Q: Testing for a Linear Correlation. In Exercises 13–28, construct a scatterplot, and find the value of...
A: Given The data is as follows: Duration Interval After 242 91 255 81 227 91 251 92 262 ...
Q: Suppose the number of radios in a household has a binomial distribution with parameters n=14 and p=6...
A: I solved exactly first three subparts because of bartleby policy if you want more please upload sepa...
Q: (a) Among 10,000 random digits, in how many cases do we expect that the digit 3 appears at most 950 ...
A:
Q: Suppose two dice (one red, one green) are rolled. Consider the following events. A: the red die show...
A:
Q: 1. Analyze and answer the following problems. Evaluate the expression -6 + 19C15. Find the unknown v...
A:
Q: Construct and illustrate the probability distribution of the problem below.
A: here given, An experiment consists of studying the number of boys in families with exactly 2 childr...
Q: Activity 1 A. Find the area under the normal curve in each of the following cases: (illustrate sketc...
A: Required probability is P(0<Z<1.63)
Q: Assuming normal distribution for thẻ scores, Inu 'a) the number of candidates whose score exceeds 58...
A: Let X : scores on an aptitude test. It is given that X ~ N(mean = 42, SD = 24), then Z = (X - mean)/...
Q: and Solve each problem. a) In a contest, there ar
A: Permutations: r is selected among n choices without replacement when order matters nPr =n!(n-r)! Com...
Q: Pollsters are concerned about declining levels of cooperation among persons contacted in surveys. A ...
A:
Q: Are the sample distributions symmetrical? Explain Some statistics books define an outlier in a data ...
A: Given:
Q: You want to find out the maximum beer consumption of The 25% spring breakers who drink the least. Th...
A: It is given that the beer consumption follows normal distribution with mean 10 and standard deviatio...
Q: A value has been measured by Instrument A 33 times with a standard deviation of 4.3. Another value h...
A: Given Information: A value is measured by Instrument A 33 times with a standard deviation of 4.3 Ano...
Q: According to a report on consumer fraud and identity theft, Indiana had 1671 complaints of identity ...
A:
Q: The Acme Company manufactures widgets. The distribution of widget weights is bell-shaped. The widget...
A:
Q: Assume you record the number of "grand prizes" for a huge sample of 100 spins. What will be the most...
A:
Q: 2. Suppose a distribution has a mean µ = 6 and standard deviation o = 2. What is the value of x if i...
A:
Q: An aptitude test for selecting officers in a bank was conducted on 1,000 candidates, the average sco...
A:
Q: The following data represents the GPA of a sample of 15 students enrolled in a math class. Use techn...
A: Introduction: For the given sample of 15 GPA values, the listed quantities are to be obtained using ...
Q: (b) What is the probability that a line width is between 0.47 and 0.63 micrometer? ANSWER: The proba...
A:

Step by step
Solved in 3 steps with 3 images

- The average remaining lifetimes for women of various ages in a certain country are given in the following table.From 1985 to 2006 the net sales for the J.M. Smucker Company increased from $157 million to $687 million. Compute the mean annual percent increase in net sales.Table 2 shows the statistics for bed count and inpatient service days that Manatee Bay Health Center reported for last year (a non-leap year). The hospital chief operations officer (COO) is meeting with the board of directors next Tuesday for a quarterly meeting. He asked you to figure the hospital's occupancy ratio for the past year. You have been given the statistics in Table 2 to calculate the annual percentage of occupancy for the past year's operations. Table 2 – Manatee Bay Health Center Hospital Bed Count and Inpatient Service Days Manatee Bay Health CenterHospital Bed Count and Inpatient Service Days Time Period Bed Count Inpatient Service Days January 1 – May 31 200…
- Compute a 95% CI for the mean age.To seethe effect of a relatively small error in the estimate of the amountof carbon-14 in a sample being dated, consider this hypotheticalsituation: A bone fragment found in central Illinois in the year 2000 contains 17% of its original carbon-14 content. Estimate the year the animal died.Using the data in Table 6–11, calculate a 3-month moving average forecastfor month 12.
- Sales of a company (in $100,000) for the last 7 years are listed in the following table. Use the data as given in the table, do not include the hundred thousand at the end of the values.Consider the discrete data in the table below. (Round to the nearest thousandth as needed.)The variable-based index values of wholesale bread prices for the years 1987-2003 are given below. Given the given, what is the fixed basis wholesale bread price index for 2001?
- a) Using the country of the United states, collect data on the quarterly (not seasonallyadjusted) consumer price index rate for 2001 – 2020. Data is presented in this table below Frequency: Quarterly observation_date USACPIALLQINMEI 2001-01-01 74.1297037765224 2001-04-01 74.9032066616881 2001-07-01 75.0016524834365 2001-10-01 74.7906971511185 2002-01-01 75.0579072387213 2002-04-01 75.8736011903506 2002-07-01 76.1970660332381 2002-10-01 76.4361487431984 2003-01-01 77.2096516283642 2003-04-01 77.4909254047881 2003-07-01 77.8706450029604 2003-10-01 77.8847086917816 2004-01-01 78.5878931328414 2004-04-01 79.7129882385370 2004-07-01 79.9942620149610 2004-10-01 80.4724274348816 2005-01-01 80.9787202324446 2005-04-01 82.0616242716767 2005-07-01 83.0601461779816 2005-10-01 83.4820568426175 2006-01-01 83.9320948848957 2006-04-01 85.3525274558365 2006-07-01 85.8306928757571 2006-10-01 85.0993810570550 2007-01-01 85.9666887466581…The times (in seconds) between sixteen consecutive eruptions of a geyser were as follows:878, 871, 906, 933, 930, 852, 890, 861, 882, 888, 897, 899, 879, 888, 848 By entering the data into R, find the following (giving answers to two decimal places):Transform the age to a z score. z= ?