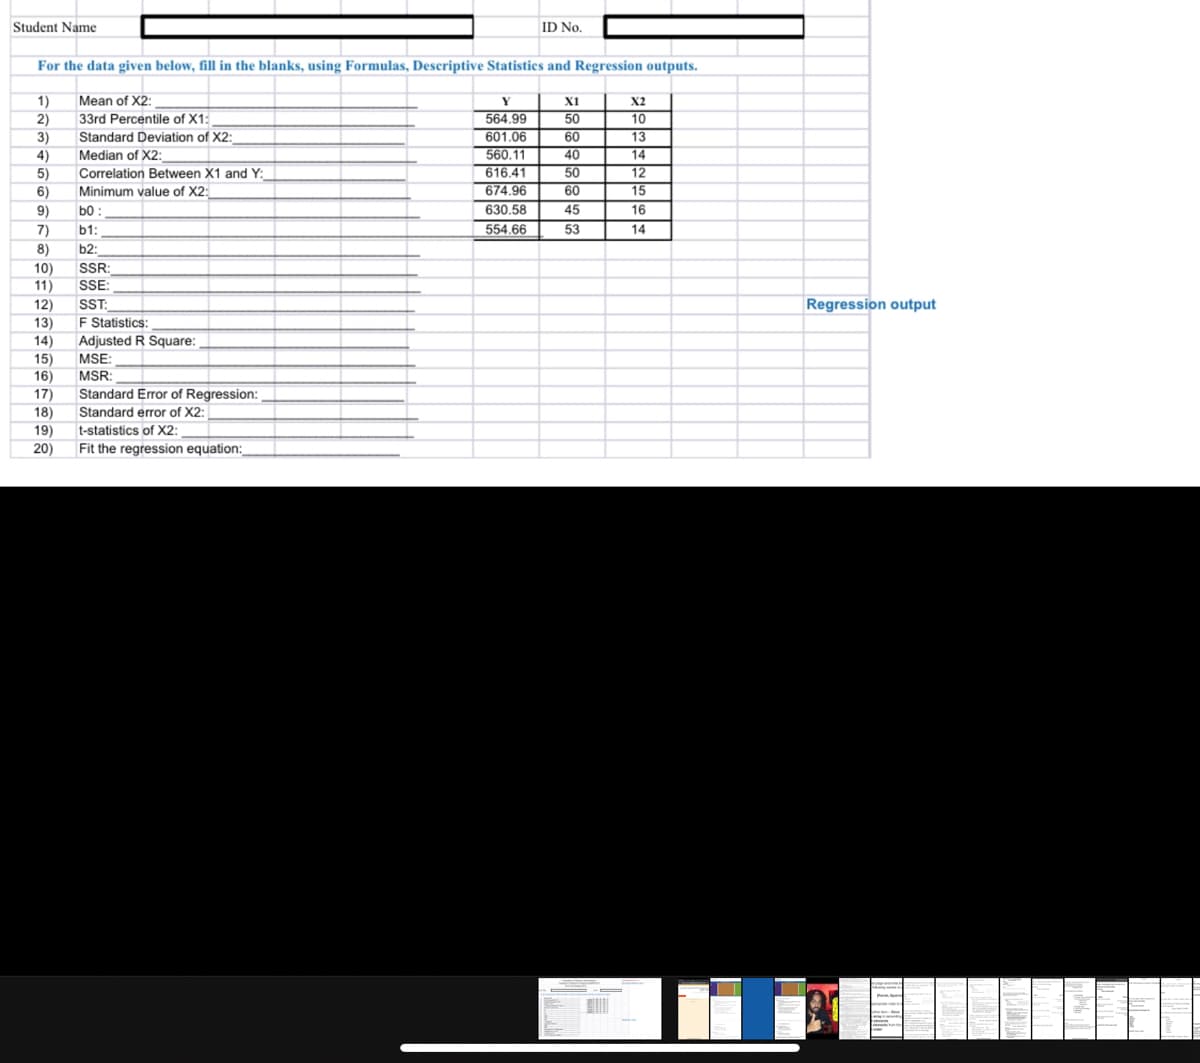
For the data given below, fill in the blanks, using Formulas, Descriptive Statisties and Regression outputs. 1) Mean of X2: Y XI X2 33rd Percentile of X1: 564.99 601.06 560.11 616.41 674.96 630.58 554.66 2) 50 10 3) Standard Deviation of X2: 60 13 4) Median of X2: 40 14 50 12 5) 6) Correlation Between X1 and Y: Minimum value of X2: 60 15 9) b0 : 45 16 53 14 7) 8) 10) 11) 12) 13) b1: b2: SSR: SSE: SST: F Statistics: Adjusted R Square: MSE: Regression output 14) 15) 16) 17) 18) 19) 20) MSR: Standard Error of Regression: Standard error of X2: t-statistics of X2: Fit the regression equation:_


Inverse Normal Distribution
The method used for finding the corresponding z-critical value in a normal distribution using the known probability is said to be an inverse normal distribution. The inverse normal distribution is a continuous probability distribution with a family of two parameters.
Mean, Median, Mode
It is a descriptive summary of a data set. It can be defined by using some of the measures. The central tendencies do not provide information regarding individual data from the dataset. However, they give a summary of the data set. The central tendency or measure of central tendency is a central or typical value for a probability distribution.
Z-Scores
A z-score is a unit of measurement used in statistics to describe the position of a raw score in terms of its distance from the mean, measured with reference to standard deviation from the mean. Z-scores are useful in statistics because they allow comparison between two scores that belong to different normal distributions.

Step by step
Solved in 2 steps with 1 images


