From the data below, plot a histogram and frequency distribution curve. Is the data normally distributed? Cell boundary Frequency Mid-value Freq x MV 2.531 - 2.535 6 2.533 15.198 2.536 - 2.540 8 2.538 20.304 2.541 - 2.545 12 2.543 30.516 2.546 - 2.550 13 2.548 33.124 2.551 - 2.555 20 2.553 51.060 2.556 - 2.560 19 2.558 48.602 2.561 - 2.565 13 2.563 33.319 2.566 – 2.570 11 2.568 28.248 2.571 - 2.575 8 2.573 20.584 Total 110 P FFXMV/110 = 2.554 280.955
From the data below, plot a histogram and frequency distribution curve. Is the data normally distributed? Cell boundary Frequency Mid-value Freq x MV 2.531 - 2.535 6 2.533 15.198 2.536 - 2.540 8 2.538 20.304 2.541 - 2.545 12 2.543 30.516 2.546 - 2.550 13 2.548 33.124 2.551 - 2.555 20 2.553 51.060 2.556 - 2.560 19 2.558 48.602 2.561 - 2.565 13 2.563 33.319 2.566 – 2.570 11 2.568 28.248 2.571 - 2.575 8 2.573 20.584 Total 110 P FFXMV/110 = 2.554 280.955

Glencoe Algebra 1, Student Edition, 9780079039897, 0079039898, 2018
18th Edition
ISBN:9780079039897
Author:Carter
Publisher:Carter
Chapter10: Statistics
Section10.1: Measures Of Center
Problem 9PPS

Related questions
Question
100%
Transcribed Image Text:ECONET
88%
5:43 AM
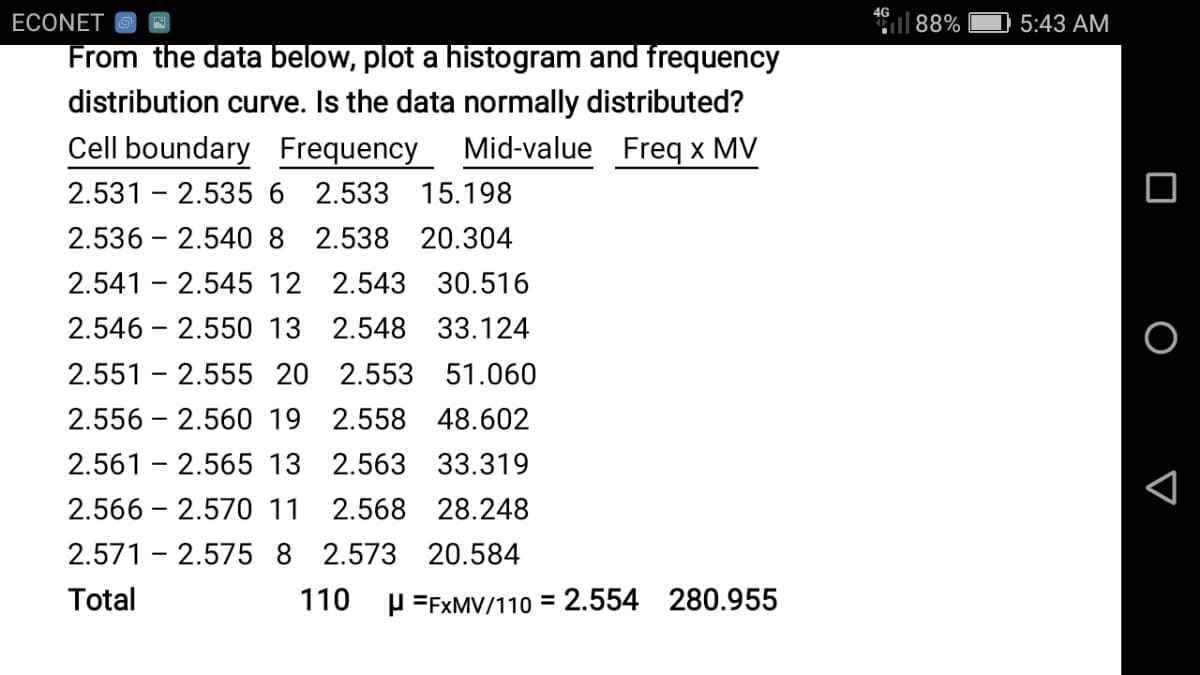
From the data below, plot a histogram and frequency
distribution curve. Is the data normally distributed?
Cell boundary Frequency
Mid-value Freq x MV
2.531 - 2.535 6 2.533 15.198
2.536 - 2.540 8 2.538 20.304
2.541 - 2.545 12 2.543 30.516
2.546 - 2.550 13 2.548 33.124
2.551 - 2.555 20 2.553 51.060
2.556 - 2.560 19 2.558 48.602
2.561 - 2.565 13 2.563 33.319
2.566 – 2.570 11 2.568 28.248
2.571 - 2.575 8 2.573 20.584
Total
110
P FFXMV/110 = 2.554 280.955
Expert Solution
This question has been solved!
Explore an expertly crafted, step-by-step solution for a thorough understanding of key concepts.

Step by step
Solved in 4 steps with 3 images

Recommended textbooks for you
Glencoe Algebra 1, Student Edition, 9780079039897…
Algebra
ISBN:
9780079039897
Author:
Carter
Publisher:
McGraw Hill
Glencoe Algebra 1, Student Edition, 9780079039897…
Algebra
ISBN:
9780079039897
Author:
Carter
Publisher:
McGraw Hill