For the density curve below, what percentage of people weigh between 150 and 152 pounds? 0.20 0.15 Relative 0.10 - Frequency 0.05- 0.00 144 146 148 150 152 154 156 Weight (pounds)
For the density curve below, what percentage of people weigh between 150 and 152 pounds? 0.20 0.15 Relative 0.10 - Frequency 0.05- 0.00 144 146 148 150 152 154 156 Weight (pounds)

Functions and Change: A Modeling Approach to College Algebra (MindTap Course List)
6th Edition
ISBN:9781337111348
Author:Bruce Crauder, Benny Evans, Alan Noell
Publisher:Bruce Crauder, Benny Evans, Alan Noell
Chapter1: Functions
Section1.2: Functions Given By Tables
Problem 2TU: Use the table of values you made in part 4 of the example to find the limiting value of the average...

Related questions
Question
100%
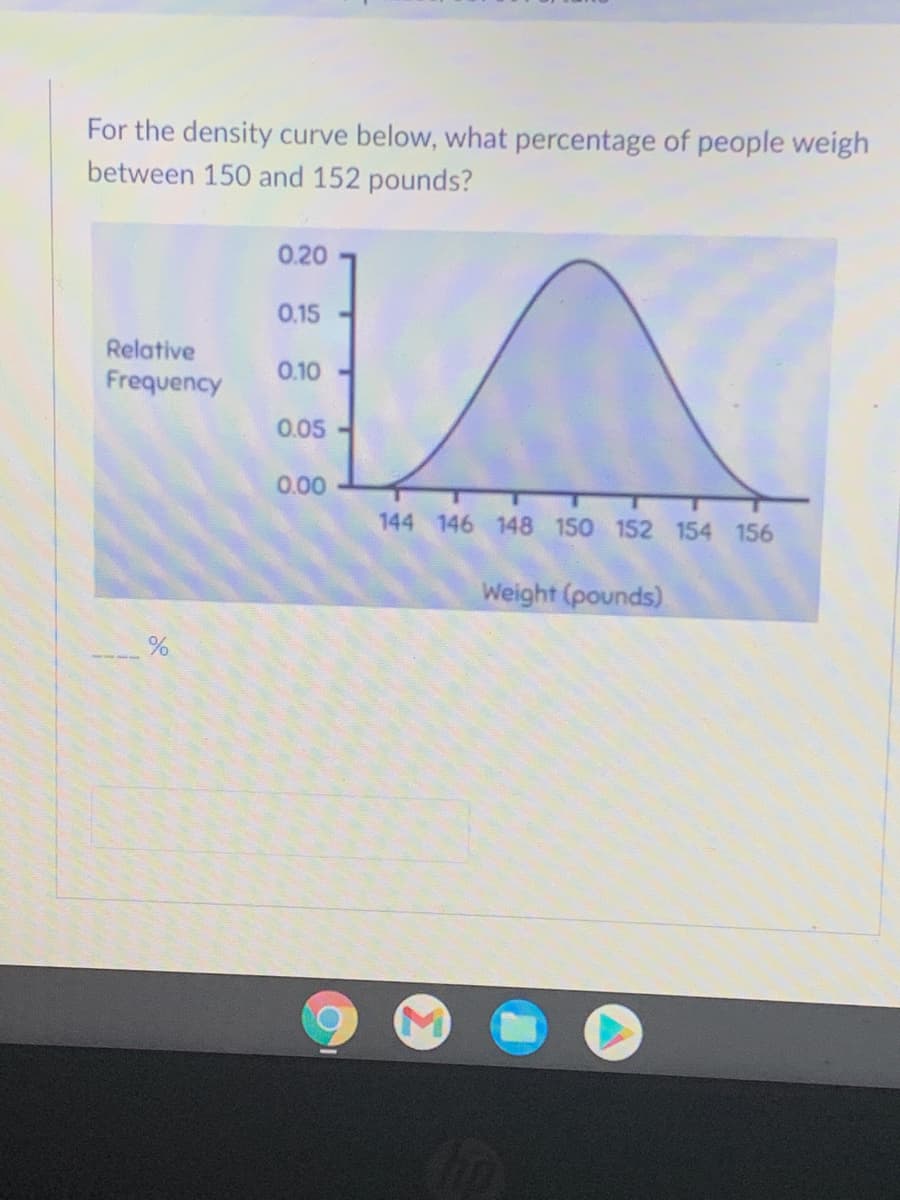
Transcribed Image Text:For the density curve below, what percentage of people weigh
between 150 and 152 pounds?
0.20
0.15
Relative
0.10 -
Frequency
0.05-
0.00
144 146 148 150 152 154 156
Weight (pounds)
EGO
Expert Solution
This question has been solved!
Explore an expertly crafted, step-by-step solution for a thorough understanding of key concepts.

This is a popular solution!

Trending now
This is a popular solution!

Step by step
Solved in 2 steps with 2 images

Recommended textbooks for you
Functions and Change: A Modeling Approach to Coll…
Algebra
ISBN:
9781337111348
Author:
Bruce Crauder, Benny Evans, Alan Noell
Publisher:
Cengage Learning
Functions and Change: A Modeling Approach to Coll…
Algebra
ISBN:
9781337111348
Author:
Bruce Crauder, Benny Evans, Alan Noell
Publisher:
Cengage Learning