For the distribution as shown: Determine the 6th decile


Q: take the following scores from an interval scale and create a frequency table with all the…
A: For the given data create a frequency table with all the appropriate columns
Q: The range of the sample data is (Round to one decimal place as needed.)
A: The maximum value of the data set is 10 and the minimum value is 1.
Q: What percent of the observations in a distribution are greater than the first quartile? O 33% 50%…
A: In statistics, a Quartile is a type of quantile which divides the number of data points into four…
Q: Find each of the requested values for the distribution shown in the following table. (d) What is…
A: Given data is appropriate for measures of dispersion to find the percentile for the given data . But…
Q: Find each of the requested values for the distribution shown in the following table. (a) What score…
A: Percentile Rank (PR): It is the measure of the relative performance, where it is the percentage of…
Q: FIND THE MEAN OF THE SET OF DATA BELOW AND CONSTRUCT A SAMPLING DISTRIBUTION BY SELECTING 3 SAMPLES…
A: Mean of the set of Data: Mean=Sum of the valuestotal=7+10+14+17+205=685=13.6
Q: Given the histogram .Calculate the median.
A:
Q: Given: Test scores are 59 95 82 78 66 82 65 78 66 66 79 82 66 82. Find the PERCENTILE for the test…
A: We have to percentile for 79 ..
Q: For the distribution in the following table, what is the percentile rank for X = 8.5?
A: Given that X C% 9 100% 8 80% 7 50% 6 25% Here, Percentile rank for x=8.5
Q: d. Find the 77th percentile for the mean score for this sample size. e. P(21.9204 < ữ < 22.6932) =…
A: d. The 77th percentile for the mean score for this sample size is,…
Q: Calculate the 3rd quartile, 9th decile and 46th percentile c the distribution
A: The partition is the measure which divide the data set into equal number of parts. Some of the…
Q: The line plot shows the surface area, in square feet, of the nine desks sold by Matt's Furniture…
A: Modulus of any number is always positive. i. e., |-a| = a where, a = all real numbers.
Q: Given the following data, found the diameter that represents the 53rd percentile.
A: Given data is1.64,1.59,1.30,1.51,1.41,1.64,1.59,1.47,1.61,1.68,1.56,1.32,1.64,1.41,1.49sample…
Q: For the data shown in the frequency distribution table below, which
A: Given frequency distribution is, categories Repetition 10-12 2 13-15 3 16-18 f1 19-21 5…
Q: Find the area above 27 for a N(15,5) distribution.
A:
Q: Use the accompanying data set to complete the following actions. a. Find the quartiles. b. Find the…
A:
Q: Which of the following formulas is used to compute the mean of the sampling distribution of the…
A:
Q: Draw a polygram for the distribution of scores shown below x f 6 2 5 5 4 3 3…
A:
Q: If the shaded area corresponds to z=-0.90, what proportion of the distribution corresponds to z >…
A: We have given that the shaded area correspond to z = -0.90.
Q: What score has a percentile rank of 50%?
A: From the given information: n=20 k=50 Therefore, using this following formula to find the LP…
Q: For the distribution in the following table, what is the percentile rank for X = 8.5? X…
A:
Q: The 50th percentile for the following data is 65, 70, 67,75, 89, 80 O a. 72.5 O b. 67 О с. 75 O d.…
A: 50th percentile is given by, P50= {(n/2th term + (n/2 +1)th term}/2 For even sample size. Here n= 6…
Q: Using the sample formulas, find the mean, variance, and standard deviation for the grouped data…
A:
Q: Based on the frequency distribution above, find the relative frequency for the class 15-18. Relative…
A: Given: Ages Number of student 15-18 10 19-22 10 23-26 10 17-30 6 31-34 5 35-38 7
Q: For the distribution in the following table, what is the 50" percentile? X c% 100% 80% 9. 8. 7 50%…
A: The pth percentile of a set of observations is the value below which, p% or (p/100) proportion of…
Q: The 12th percentile is (Round to two decimal plac
A: X~ N(μ=46 , σ= 7) then Z=X-μσ=X-467 ~N(0,1) Let P12 be the 12th percentile and is defined as P(X ≤…
Q: Use the accompanying data set to complete the following actions. a. Find the quartiles. b. Find the…
A: Given : 65,60,57,59,57,56,56,56,65,64,62,54,63,60,83 Arrange in ascending order 54, 56, 56, 56,…
Q: For the following frequency distribution, how many individual scores are in the entire set?
A: In this question, we use the given frequency table to find the * total score * sum of x The…
Q: • Which of the following measures is not sensitive to outliers (B) median (A) mean (C) range (D)…
A: Need to find which of the given measures is not sensitive to outliers. Mode is not sensitive to…
Q: percentile rank for X = 45?
A: Percentile Rank: The percentile rank of a score is the percentage of scores in its frequency…
Q: 0.38 0.76 0.85
A: As per given by the question, there are three points are given and find the percentile points for…
Q: The heights (at the shoulders) are: 600mm, 470mm, 170mm, 430mm and 300mm. Find out the Mean, the…
A: Here, x x-x (x-x)2 600 206 42436 470 76 5776 170 -224 50176 430 36 1296 300 -94 8836…
Q: The five number summary for the average annualwage per employee for each U.S state and D.C is given…
A: Here is given that, Min = 333532 Q1 = 38057 Q2 = 40577 Q3 = 46267.5 Max = 77843
Q: Using the stemplot of annual precipitation (inches) below, determine the median, upper quartile,…
A: Hi! Thank you for the question, As per the honour code, we are allowed to answer three sub-parts at…
Q: Take the following scores from an interval scale and create a frequency table with all appropriate…
A: For the Given data, create a frequency table with all appropriate columns
Q: Calculate the 75th percentile of the data shown
A: The Kth percentile formula is, L=K100×Nthposition In the formula N is the sample size. The data is…
Q: An instructor recorded the following number of correct items (in a quiz with 10 questions) for the…
A: Here we had given that exam is multiple choice exam and the score is our variable. We had given 12…
Q: Find the area above 29 for a N(15,5) distribution
A:
Q: For the uniform distribution below, what proportion of values are located between 12.3 and 18.6?…
A:
Q: Find each value requested for the distribution of scores in the following table. а. п b. ΣΧ c. Σχ f…
A: a. The symbol Σ defines the sum of all of the scores of a data set.
Q: P(x) 0.03 1 0.07 2 0.33 3 0.36 0.08 0.13 5.
A: Mean(x)=∑x·P(x) Calculating x*P(x) x P(x) x*P(x) 0 0.03 0 1 0.07 0.07 2 0.33 0.66 3 0.36…
Q: Set up the following scores into a grouped frequency distribution. Obtain relative frequency and…
A:
Q: If a distribution of scores is shown in a bar graph, you know that the scores were measured on aln).…
A:
Q: Find each value requested for the distribution of scores in the following table. а. п b. ΣΧ c. EX? f…
A:
Q: Identify the shape of the following distributions: 1. 2. 3. 4. 5.
A: Given that
Q: Calculate the percentile for the following the marks obtained by 9 students are given below: 45 32…
A: Percentile is a number where a certain percentage of scores fall below that given number. The…
Q: The trunk diameter, in centimeters, of a certain variety of pine tree is represented by X~N(150,…
A: Solution: Let X be the trunk diameter in centimeters of a certain variety of pine trees. From the…
Q: The following data are given to you to find out whether the distribution is platykurtic N= 100, Efd,…
A: Concentration of all the values around the central value of the given data is known as measures of…
Q: Find the area below 47 for a N(60,10) distribution.
A:
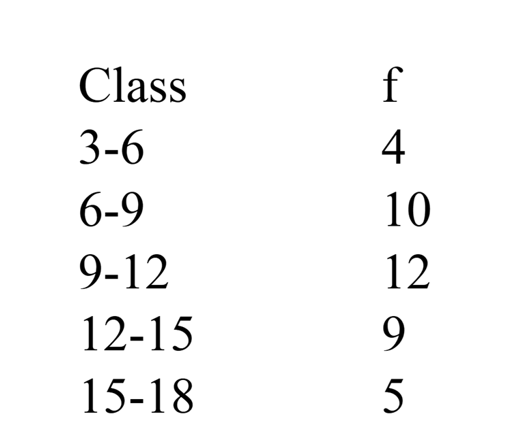
For the distribution as shown:
Determine the 6th decile

Step by step
Solved in 2 steps
