Use the accompanying data set to complete the following actions. a. Find the quartiles. b. Find the interquartile range. c. Identify any outliers. 62 63 65 61 57 62 63 63 59 63 55 56 64 58 75 a. Find the quartiles.
Use the accompanying data set to complete the following actions. a. Find the quartiles. b. Find the interquartile range. c. Identify any outliers. 62 63 65 61 57 62 63 63 59 63 55 56 64 58 75 a. Find the quartiles.

Glencoe Algebra 1, Student Edition, 9780079039897, 0079039898, 2018
18th Edition
ISBN:9780079039897
Author:Carter
Publisher:Carter
Chapter10: Statistics
Section10.4: Distributions Of Data
Problem 1GP

Related questions
Question
Practice Pack
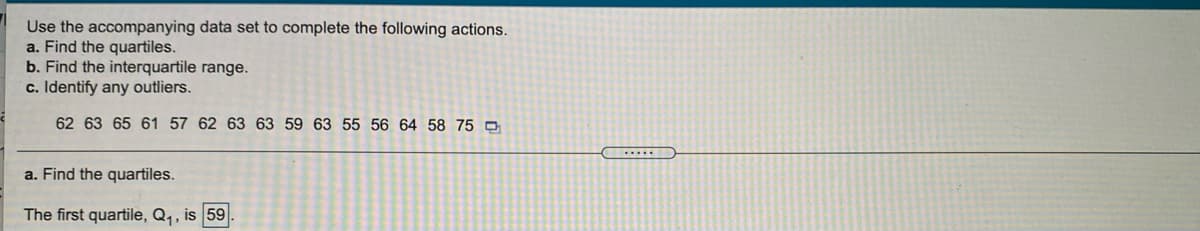
Transcribed Image Text:Use the accompanying data set to complete the following actions.
a. Find the quartiles.
b. Find the interquartile range.
c. Identify any outliers.
62 63 65 61 57 62 63 63 59 63 55 56 64 58 75 O
a. Find the quartiles.
The first quartile, Q, , is 59
Expert Solution
This question has been solved!
Explore an expertly crafted, step-by-step solution for a thorough understanding of key concepts.

Includes step-by-step video

Learn your way
Includes step-by-step video

Step by step
Solved in 4 steps with 6 images

Recommended textbooks for you
Glencoe Algebra 1, Student Edition, 9780079039897…
Algebra
ISBN:
9780079039897
Author:
Carter
Publisher:
McGraw Hill
Glencoe Algebra 1, Student Edition, 9780079039897…
Algebra
ISBN:
9780079039897
Author:
Carter
Publisher:
McGraw Hill