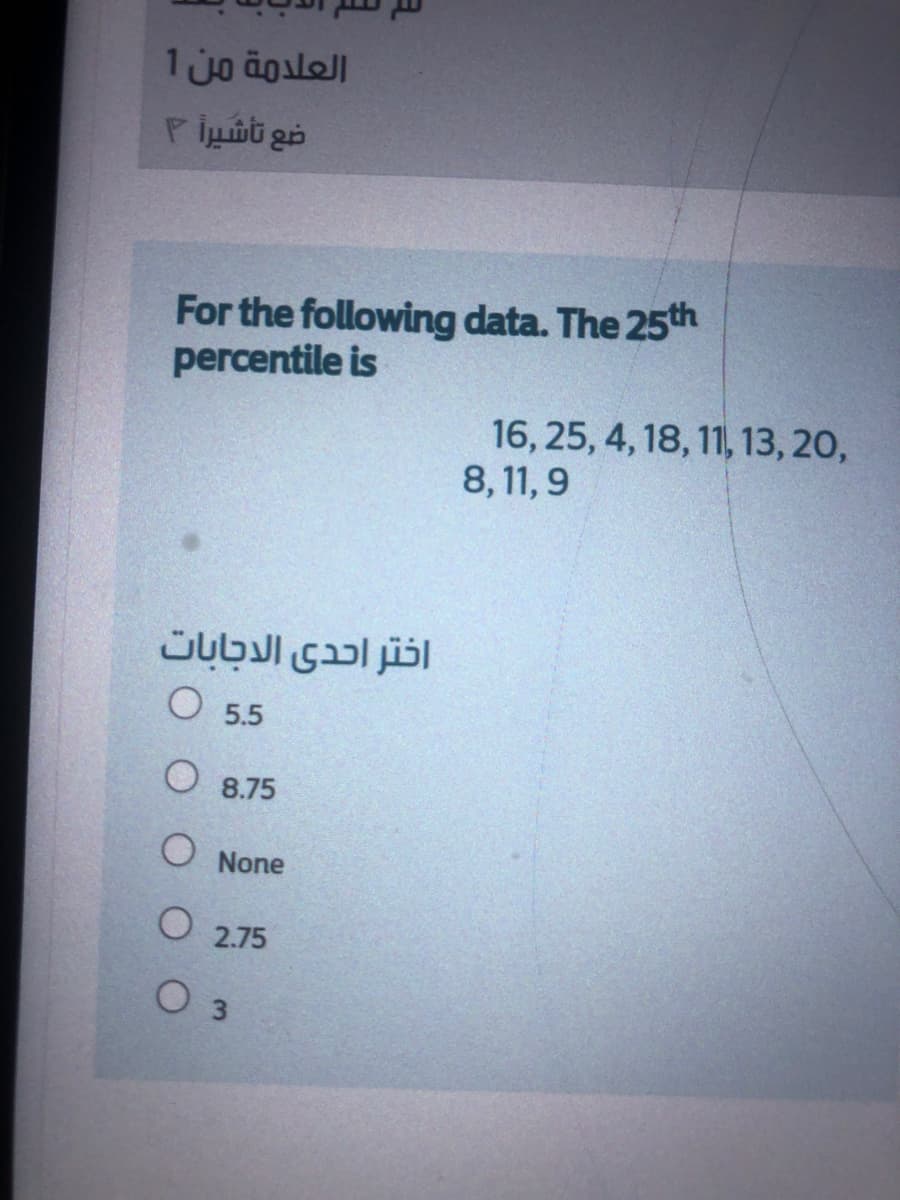
For the following data. The 25th percentile is 16, 25, 4, 18, 11, 13, 20, 8,11, 9 اختر احدى الدجابات O 5.5 O 8.75 O None O 2.75 O 3


Q: Calculate the 55th percentile of the data shown x 2.8 3.5 4.3 7.3 9.2 19.1
A: Number of observation (n) = 6 55th percentile (P55) = Pk
Q: Given the following data set that presents 30 test scores on an exam, find the position of the 63rd…
A: Percentile: The observations P1, P2, - - - P99 which divide the total number of observations into…
Q: that presents 30 test scores on an exam, find the 63rd percentile. State your result/answer as a…
A: Let X be the test scores on an exam. The given data is : 49.5, 48, 51, 50, 53.2, 52, 55, 54, 57, 56,…
Q: For the following list of data, calculate (a) the mean, (b) the median, and (c) the mode or…
A:
Q: For the following data obtain (i) mean, (ii) median, (iii) mean deviation from median, and (iv) the…
A:
Q: Given the following data set that presents 30 test scores on an exam, find the 95th percentile.…
A: 95th percentile= 95*(n+1)/100th term
Q: The following pH data were collected in the analysis of water from a lake as part of an acid rain…
A: Given That : The pH data obtained from the analysis of water. 4.17, 4.20,4.19,4.23, 4.22, 4.14,…
Q: QUESTION 4 Find the 74th percentile, P74, from the following data 4 6 8 9 10 12 24 26 38 42 43 44…
A:
Q: For the following data set, complete the table and determine the mean, median, mode, and standard…
A: The mean is calculated using the formula x¯=∑fx∑f The median is calculated using the formula…
Q: The table to the right shows selected ages of licensed drivers in one country and the corresponding…
A: The objective is to find the percentage of drivers who are younger that 55. Given the percentile of…
Q: Find the 24th percentile, P24, from the following data 1 2 3 4 14 18 19 20 21 24 25 29 34 42 43 44…
A:
Q: The 50th percentile for the following data is 65, 70, 67, 75, 89, 80 O A. 67 O B. 75 OC. 72.5 O D.…
A: The given data set is, 65, 70, 67, 75, 89, 80 First, sort the values of data set. The sorted values…
Q: Calculate the 55th percentile of the data shown x 2.8 3.5 4.3 7.3 9.2 19.1 Is this correct…
A:
Q: For the following ordered set of data, find the 60th percentile. 0, 2, 3, 5, 5, 6, 8, 10, 10, 11,…
A: Note: If "L" is a whole number then the value of the kth percentile is the midway between Lth value…
Q: Find the 14th percentile, P14, from the following data 2 8. 9 16 22 23 26 35 37 38 39 41 51 62 63 69…
A: For the given data sample size is, n= 29 14th percentile is given by, P14= 14*(n+1)/100 th term
Q: For the following data from a repeated-measures study, calculate the mean difference…
A: Given, Participants X1 (Music) X2 (No Music) A 1 5 B 4 6 C 5 2
Q: Use the following set of intestinal pH data. Calculate Pso (that is, the 50th Percentile., and place…
A: Calculate Percentiles-50 from the following data5,6,7,7,5,7,6,7,6,4
Q: For the following Grouped Frequency Data Table (GFDT) answer the questions below. Lower Class…
A: Class interval Frequency Cumulative Frequency 30-34 10 10 35-39 9 19 40-44 4 23 45-49 10 33…
Q: Refer to the following distribution of commissions: What is the relative frequency of those…
A:
Q: Examine the following data set. 1.3, 2.5, 3.1, 4.2, 5.7, 5.7, 5.7, 6.4, 6.4, 8.9, 8.9, 9.1, 11.7,…
A: Given data, 1.3,2.5,3.1,4.2,5.7,5.7,5.7,6.4,6.4,8.9,8.9,9.1,11.7,12.2,12.6,13,14.4,15 What is the…
Q: The following are final grades (in terms of percentages) from a class of 20 students. 70 75 70 84 90…
A: The mean of the data is,…
Q: Given the following data set that presents 30 test scores on an exam, find the 95th percentile.…
A: Given data and calculation for mean and sample standard deviation is shown below
Q: Consider the following data on blood pressure: Find the following statistics: 1 Median. 2 25th…
A: To find the median and Percentiles, first arrange the data into ascending order. If the number of…
Q: Calculate the 20th percentile of the data set shown 5.5 7.5 14 14.5 15.8 18 19.3 23.7 24.3 26.1
A: Given information: 5.5, 7.5, 14, 14.5, 15.8, 18, 19.3, 23.7, 24.3, 26.1
Q: Calculate the 30th percentile of the data shown x 4.8 12.8 17.3 22.9 26.2
A: Given data, x 4.8 12.8 17.3 22.9 26.2 Here, n=5 30th percentile=?
Q: The following data relates to the sizes of shoes sold at a store during a given week. Find the…
A:
Q: Consider the following dataset: 17 17 18 27 36 37 40 45 53 66 67 68 68…
A: Percentile rank could be defined as the place secured by any value within the total number of values…
Q: Examine the following data set. 1.3, 2.5, 3.1, 4.2, 5.7, 5.7, 5.7, 6.4, 6.4, 8.9, 8.9, 9.1, 11.7,…
A: We have given the following set of data- 1.3, 2.5, 3.1, 4.2, 5.7, 5.7, 5.7, 6.4, 6.4, 8.9, 8.9, 9.1,…
Q: the 28th percene. of Newborn bies 9.5 5.1 6.0 8.0 8.6 5.7 9.3 6.2
A: Given that data 6.1,9.1,9.5,6.0,8.6,6.2,9.1,6.1,8.0,5.7,6.5,6.4,5.8,9.3,6.2 Arranging Observations…
Q: Find the mean, median, and mode for the scores in the following frequency distribution table: X f 6…
A: Given that the frequency table to calculate mean, median and mode.MEAN:For discrete series,
Q: Given the following data set, find the approximate value that corresponds to the 75th percentile.…
A: The data set is: 10, 44, 15, 23, 14, 18, 72, 56
Q: (d) What height corresponds to the 95th percentile in the Galton study?
A:
Q: Consider the following dataset: 12 15 32 52 54 58 86 89 Find the percentile rank…
A: Arranging the given data in ascending order: 12 15 32 52 54…
Q: Consider the following 15 observations 2, 4, 4, 5, 7, 8, 10, 12, 17, 18, 18, 21, 27, 29, 30 What…
A: The given data set is: 2,4,4,5,7,8,10,12,17,18,18,21,27,29,30
Q: Find the 94th percentile, P94, from the following data 3 10 12 14 16 17 29 30 31 33 36 39 45 48 51…
A: Solution
Q: Given the following data set that presents 30 test scores on an exam, find the 73rd percentile.…
A: Given data is appropriate for measures of central tendency . To find the 73rd percentile for the…
Q: For the following data set, find Q1, Q2, Q3 and the interquartile range. 15, 12, 23, 15, 7, 8, 21,…
A: The following data has been given: 15, 12, 23, 15, 7, 8, 21, 10, 12, 14, 16, 24, 19
Q: Consider the following data set: {4, 4, 5, 6, 7, 5, 3, 2} . What is the relative frequency of the…
A:
Q: The table to the right shows selected ages of licensed drivers in one country and the corresponding…
A: From the table, the percentile corresponding to the age 35 is 39 indicating that there are 39% of…
Q: For the following data: X-1.2.2. 3,3, 3, 4,4,4, 4, 5. 5.5, 6,6,6, 7,7.8 91 Find: A) Arithmetic mean,…
A: (A) The formula for the arithmetic mean is, The table with the necessary calculation is shown…
Q: for the sample of scores in the following frequency distribution table what is the mean? x 5 4 3 2…
A:
Q: Given the following data. Find the mean: 2,3, 7, 8, 5, 0,1, 6 اختر احدى الدجابات O 2 O 3 O 4 None
A: GIven data is2,3,7,8,5,0,1,6Let x denotes the given data setx={2,3,7,8,5,0,1,6}sample size(n)=8
Q: Calculate the 30th percentile of the data shown x 4.8 12.8 17.3 22.9 26.2
A: Given: Number of observation (n) = 5 30th percentile (P30)= Pk
Q: The following data represents the age distribution of a sample of 100 people covered by Health…
A: The given is suitable for measures of central tendency .
Q: For the following data obtain () mean, (ii) median, (i) mean deviation from median, and (iv) the…
A:
Q: The data below represents the lower blood pressure for people in our class. 88 76 96 114 65 84 86 91…
A:
Q: What is the percentile for your 10th data point? (when they are arranged in order) Number of Frogs…
A: Percentile are the values of variates from we form the cummulative frequencies are…
Q: Find the 64th percentile, P64, from the following data 3 12 15 31 36 47 48 50 2 18 21 23 40 44 55 56…
A: Given data: 2,3,12,15,18,21,23,31,36,40,44,47,48,50,55,56,59,60,69,75,81,82,86,88,90,92,93,94,96
Q: For the following data: 18, 15, 12, 6, 8, 2, 3, 5, 20, 10. Find the value corresponding to the 25th…
A:
Q: The following data have been collected from a sample of 8 items 10, 8, 12, 15, 13 ,11, 6 ,5 The…
A: Answer : False ❌


Trending now
This is a popular solution!

Step by step
Solved in 3 steps with 2 images
