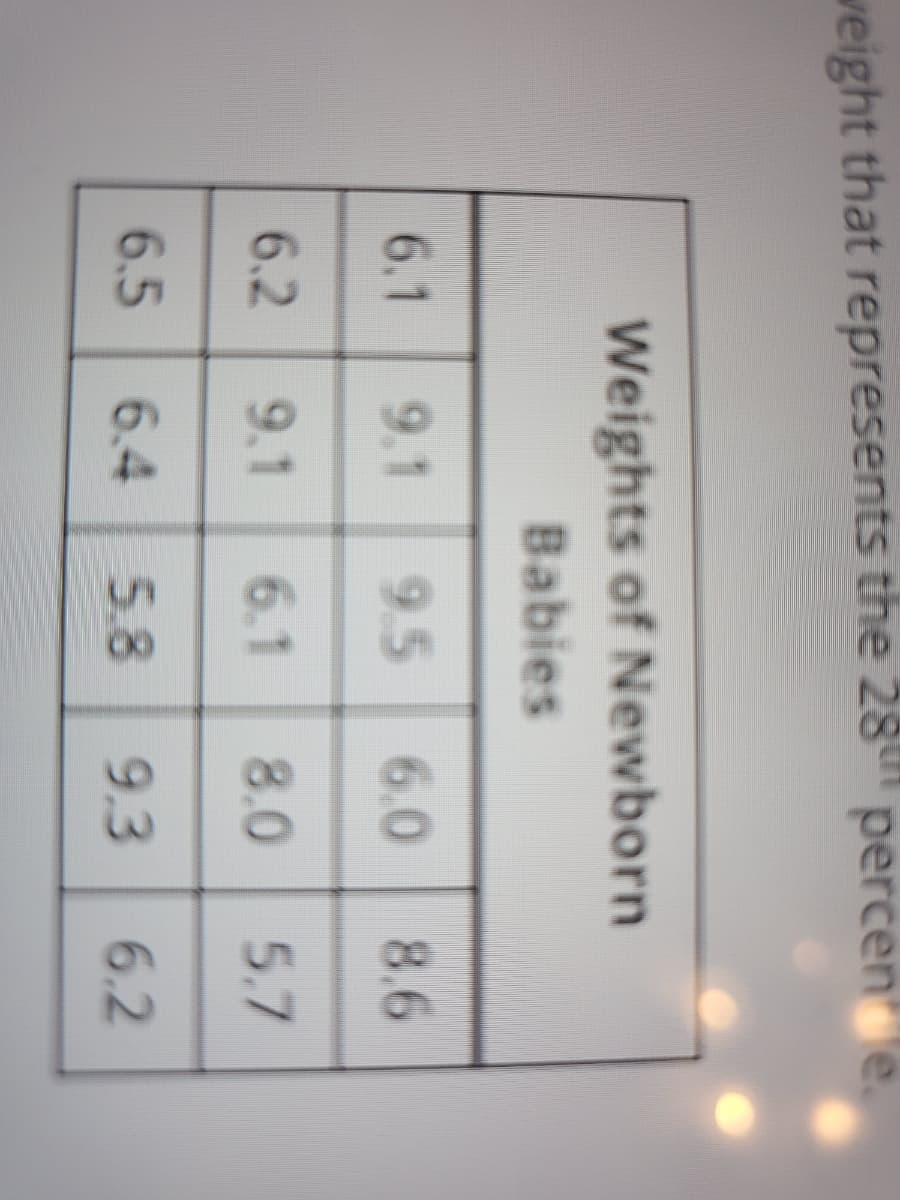
the 28th percene. of Newborn bies 9.5 5.1 6.0 8.0 8.6 5.7 9.3 6.2


Q: Consider a set of equity returns from four different markets across 12 different periods. The data…
A: It is given that the first three sets of equity returns from markets are the explanatory variable…
Q: The S&P 500 is currently at a value of 4,130 (as of July 29th, 2022 market close). On the same day,…
A: First Here we use futures price formula : Ft=St×e(rf-q)×tWhere,Ft=Theoretical price of…
Q: Average wages of some firms are given below. Represent this by Simple Bar Diagram. C Firm A B D E F…
A:
Q: Find the area of the shaded region. The graph depicts the standard normal distribution of bone…
A: From the provided information, Mean (µ) = 0 Standard deviation (σ) = 1
Q: b) Within 5 cm of the mean, P(115 < X < 125).
A:
Q: State whether the standardized test statistic t indicates that you should reject the null…
A: We have given that t-critical value t0 = -1.681 And test statistic, t = 0
Q: For 50 randomly selected speed dates, attractiveness ratings by males of their female date partnerS…
A: The p-value is 0.046.
Q: A screening test for a newly discovered disease is being evaluated. To determine the effectiveness…
A: Hi! Thank you for the question, As per the honor code, we are allowed to answer three sub-parts at a…
Q: Each observation in a random sample of 101 bicycle accidents resulting in death was classified…
A: Given: n = 101 α = 0.05 Formula Used: Test-statistic χ2 = ∑(O-E)2E
Q: The average number of accidents at controlled intersections per year is 4.9. Is this average a…
A: Given information: Population mean, μ=4.9 Sample size, n=67 Sample size, x¯=5 Sample standard…
Q: a. Write the estimated regression equation (to whole number). ý= = + b. Compute the F statistic and…
A: first we complete ANOVA: df (Regression) =k =1df (Residual) = n-k-1 =30-1-1=28df (Residual ) = n-1…
Q: Use the given confidence interval limits to find the point estimate p^ and the margin of error ME.…
A: The following information has been given: The confidence interval limits are 0.57<p<0.63
Q: We constructed a 95% confidence interval for a population mean. Which of the following would cause…
A: The objective is to identify which of the given statements would cause the confidence interval to…
Q: survey, 26 people were asked how much they spent on their child's last birthday gift. The results…
A: Given data,n=26Mean x=42sd s=14Construct a 98% CI
Q: The mean daily production of a herd of cows is assumed to be normally distributed with a mean of 39…
A:
Q: The Wall Street Journal asked Concur Technologies, Inc., an expense management company, to examine…
A: Given Information: Sample size n=9 Equation of the regression line: y^=17.49+1.0334x
Q: Let x be a random variable that represents the pH of arterial plasma (i.e., acidity of the blood).…
A: The sample size n nis 36.
Q: A light bulb manufacturer guarantees that the mean life of a certain type of light bulb is at least…
A: Given: sample size(n)=29 sample mean(x¯)=756population standard deviation(σ)=64Population…
Q: If the test statistic on a 2-sided test is 2.8880 with a p-value of 0.0447, what would be the…
A: We have given that Test statistic = 2.8880 p-value = 0.0447 Significance level (α) = 3% = 0.03
Q: The mean and standard deviation for the final exam in Dr. Fudd's class were as follows: mean = 86…
A: Concept: Z is known as standard normal variable Z= (X-mean)/standard deviation
Q: Fifty-four wild bears were anesthetized, and then their weights and chest sizes Correlation Results…
A: Given Information: Correlation coefficient, r: 0.956849 Critical r: ±0.2680855 P-value…
Q: Hi! I just need Part #4 and #5. The following table shows the systolic blood pressure of 5 women…
A: Given that The following table shows the systolic blood pressure of 5 women and 5 men. Women…
Q: Show your work to find the value that is 1.5 standard deviations: a. above the mean. b. below the…
A: From the obtained results, the mean is 9.02 and the standard deviation is 5.7910.
Q: In a particular river, a certain micro-organism occurs at an average rate of 10 per mililitre. A…
A: Given: Population average rate per milliliter λ=10 Sample average micro organisms = 3478 Sample size…
Q: Use the t-distribution and the given sample results to complete the test of the given hypotheses.…
A:
Q: An IQ test is developed such that the mean quotient is 100 and standard deviation is 12. It is given…
A: According to the given information in this question There are more than three subparts according to…
Q: A researcher investigated four different word lists for use in hearing assessments. She wanted to…
A: Given that World list A World list B World list C World list D Sample size 24 24 24 24…
Q: A researcher studied the relationship between the number of times a certain species of cricket will…
A: The future value estimated based on the another variable is known as prediction. The prediction can…
Q: The mean annual incomes of certified welders are normally distributed with a mean of $51,050 and a…
A: We have given that Population mean (µ) = 51050Standard deviations (σ) = 2000Sample size (n) =…
Q: Ten students independently performed an experiment to estimate the value on . Their results were:…
A: Given: Sample size n = 10 ∑X2 = 97.0011 Formula Used: Sample mean X = ∑Xin Sample variance s2 =…
Q: State the appropriate null and alternative hypotheses. ⒸM₂: MO ⒸM₂ M₂ TO ⒸM₂ M₂ O ⒸM₂: My O M₂: MO…
A: Frist we make table : Velocity(m/s) Swimmer Water x Guar Syrup y di=x-y di2 1 0.9 0.93…
Q: The lengths of metal strips are normally distributed with a mean of 120 cm and a standard deviation…
A: Given that The lengths of metal strips are normally distributed with a mean of 120 cm and a standard…
Q: An article appeared in an Australian newspaper. It described a study of academic performance and…
A:
Q: The data summarized in the accompanying table is from a paper. Suppose that the data resulted from…
A: In the given scenario, a survey was conducted to find the difference between the number of meals…
Q: Let X₁, X₂, ..., Xn denote independent and identically distributed random variables from a…
A: Given f(x)=1/θrxr-1e-x^r/θ Find mle
Q: i) Calculate the expected value of S. ii) Calculate the variance of S. iii) Determine E (1145 - 7S -…
A: Here given, Let S be a continuous random variable representing the students' study time (in hours)…
Q: Sample 1 Sample 2 (from polluted lake) (from unpolluted lake) 0.580 0.382 0.711 0.276 0.571 0.570…
A: Given: n1 = 5 n2 = 4 α = 0.1 Formula Used: Test-statistic t = X1 - X2s12n1+s22n2
Q: You estimate a simple linear regression model using a sample of 62 observations and obtain the…
A: Given that: The linear regression equation is given as, y=97.25+33.74x 3.86 9.42 State the…
Q: b) The following table shows the time spent in reading a book by a group of standard six students…
A: First we calculate mid value (X). X=( lower limit+upper limit of the class)/2 Mean is 46.9615…
Q: An article discusses the different roles taken by lionesses as they attack and capture prey. The…
A: Given that: Role Position Initiate Chase Participate in Chase Center 26 46 Wing 67 43…
Q: Here is a link to the data set collected by the researchers containing patient responses concerning…
A:
Q: The data was obtained in a study on the number of absences in the day and the final of seven…
A: a) In the given situation, the final grades of the students are estimated based on the number of…
Q: The following table shows the daily allowance for a sample of 60 employees in Company A. No. of…
A: a) The daily allowance for 60 employees in Company A is given.
Q: A random sample of 83 eighth grade students' scores on a national mathematics assessment test has a…
A:
Q: The following data represent the pH of rain for a random sample of rain dates. A normal probability…
A: Given data is5.58,5.72,4.99,4.80,5.02,4.59,4.74,5.19,5.34,4.76,4.56,5.71sample size(n)=12
Q: ello, I really need help with solving this problem. Can you please show ALL your work for each step?…
A: To determine if there is a linear correlation in the population of all husbands and wives at the 5%…
Q: Month January February March April May June July August September October November December Number…
A: By applying the Chi-square test for goodness of fit, c) Grand sum (N) = 717 expected proportion…
Q: The organizer of a conference is selecting workshops to include. She will select from 8 workshops…
A: We have given that She will select from 8 workshops about music and 8 about poetry.
Q: a) Given the bonus b, the salesperson's best response function is b) Suppose the dealership pays b =…
A: From given data we have : Her effort = e probability she sell 4 cars = 4e probability she sell 1…
Q: Use the Student's tt-distribution to find the tt-value for each of the given scenarios. Round…
A: Hey there! Thank you for posting the question. Since your question has more than 3 parts, we are…


Trending now
This is a popular solution!

Step by step
Solved in 2 steps

- If there is no seasonal effect on human births, we would expect equal numbers of children to be born in each season (winter, spring, summer, and fall). A student takes a census of her statistics class and finds that of the 120 students in the class, 24 were born in winter, 36 in spring, 32 in summer, and 28 in fall. She wonders if the excess in the spring is an indication that births are not uniform throughout the year. Complete parts a through c below. Question content area bottom Part 1 a) Compute the standardized residual for each season. Standardized Residual Winter Spring Summer Fallصورة من Sora AlsaadAlpesh
- While traveling through South America, a student decides to analyze which country is the friendliest. He measures friendliness by seeing whether or not a person, when asked for directions, gives a reply. For each country, he gathers data on hundreds of people. The four countries analyzed are Argentina, Chile, Brazil, and Uruguay.A college has approximately 3500 students. If we study those who are taking only American history and ask how many miles they travel to college each day. This resulting number is called a A) parameter B) statistics C) census D) sample170 people are asked how many siblings they have? # of Siblings Frequency Relative Frequency Cumulative Frequency 0 0.2235 38 1 32 0.1882 70 2 35 0.2059 105 3 23 128 4 42 0.2471
- A veterinarian researcher would like to know if the gestation period of an animal can be used to predict the life expectancy. She collects the following data: Animal Gestation Period (Days) Life Expectancy (Years) Cat 63 11 Chicken 22 7.5 Dog 63 11 Duck 28 10 Goat 151 12 Lion 108 10 Parakeet 18 8 Pig 115 10 Rabbit 31 7 a. ADDITIONAL INFORMATION: SQUIRREL IS 44 DAYS GESTATION PERIOD, PREDICT THE LIFE EXPECTANCY.Movie Genre Superhero Comedy Drama Total 6th grade 13 17 9 39 7th Grade 16 20 13 49 8th Grade 14 18 12 44 Total 43 55 34 132 What percent of the 6th graders prefer comedies?1.The table below contains data on the weight (in pounds) of forty 14 month old boys.
