For the following data,

Glencoe Algebra 1, Student Edition, 9780079039897, 0079039898, 2018
18th Edition
ISBN:9780079039897
Author:Carter
Publisher:Carter
Chapter4: Equations Of Linear Functions
Section4.5: Correlation And Causation
Problem 23PFA

Related questions
Question
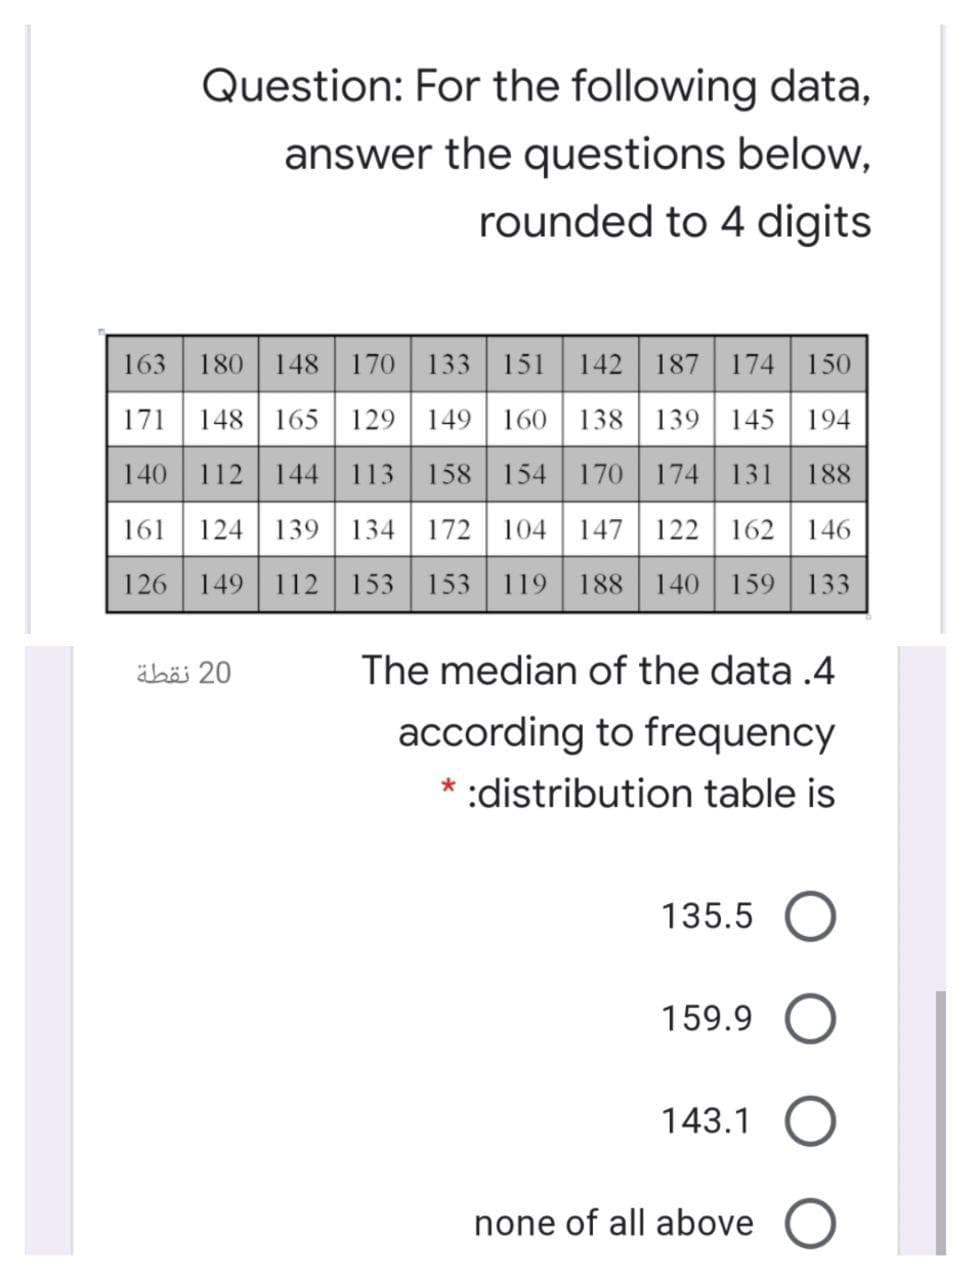
Transcribed Image Text:Question: For the following data,
answer the questions below,
rounded to 4 digits
163 180 148 170 133 151 142 187 174 150
171 148 165 129 149 160 | 138 | 139 145 194
140
112 144 113 158 154 170 | 174 131 188
161 124 139 134 172 104 147 122 162 146
126 149 112 153 153 119 188 140 159 | 133
äböi 20
The median of the data .4
according to frequency
* :distribution table is
135.5 O
159.9
143.1
none of all above O
Expert Solution
This question has been solved!
Explore an expertly crafted, step-by-step solution for a thorough understanding of key concepts.

Step by step
Solved in 2 steps with 2 images

Recommended textbooks for you
Glencoe Algebra 1, Student Edition, 9780079039897…
Algebra
ISBN:
9780079039897
Author:
Carter
Publisher:
McGraw Hill
Glencoe Algebra 1, Student Edition, 9780079039897…
Algebra
ISBN:
9780079039897
Author:
Carter
Publisher:
McGraw Hill