For the following exercise, refer to the graph of the coffee market on the right. Event: Suppose that new research shows coffee reduces the risk of heart disease. In the graph of the coffee market (using the line drawing tool) show how the demand curve will change as a result of the event described above. Label the new demand curve 'D₂'. Note: if you are not prompted for a label, then you have used the wrong drawing tool. For the following exercise, refer to the graph of the coffee market described on the right portion of your screen. Event: Suppose that average consumer income increases and coffee is a normal good. In the graph of the coffee market (using the line drawing tool) show how the demand curve will change as a result of the event described above. Label the new demand curve 'D₂'. Note: if you are not prompted for a label, then you have used the wrong drawing tool. C Price per kg Price per kg Quantity of coffee per week (millions of kgs) D₁ Quantity of coffee per week (millions of kgs)
For the following exercise, refer to the graph of the coffee market on the right. Event: Suppose that new research shows coffee reduces the risk of heart disease. In the graph of the coffee market (using the line drawing tool) show how the demand curve will change as a result of the event described above. Label the new demand curve 'D₂'. Note: if you are not prompted for a label, then you have used the wrong drawing tool. For the following exercise, refer to the graph of the coffee market described on the right portion of your screen. Event: Suppose that average consumer income increases and coffee is a normal good. In the graph of the coffee market (using the line drawing tool) show how the demand curve will change as a result of the event described above. Label the new demand curve 'D₂'. Note: if you are not prompted for a label, then you have used the wrong drawing tool. C Price per kg Price per kg Quantity of coffee per week (millions of kgs) D₁ Quantity of coffee per week (millions of kgs)

Chapter4: Utility Maximization And Choice
Section: Chapter Questions
Problem 4.2P

Related questions
Question
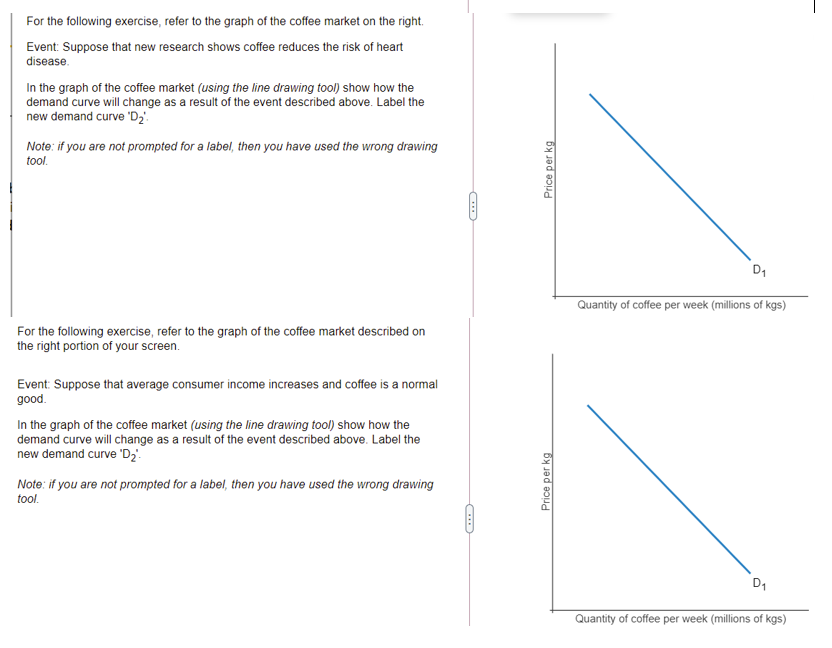
Transcribed Image Text:For the following exercise, refer to the graph of the coffee market on the right.
Event: Suppose that new research shows coffee reduces the risk of heart
disease.
In the graph of the coffee market (using the line drawing tool) show how the
demand curve will change as a result of the event described above. Label the
new demand curve 'D₂'.
Note: if you are not prompted for a label, then you have used the wrong drawing
tool.
For the following exercise, refer to the graph of the coffee market described on
the right portion of your screen.
Event: Suppose that average consumer income increases and coffee is a normal
good.
In the graph of the coffee market (using the line drawing tool) show how the
demand curve will change as a result of the event described above. Label the
new demand curve 'D₂'.
Note: if you are not prompted for a label, then you have used the wrong drawing
tool.
C
←
Price per kg
Price per kg
D₁
Quantity of coffee per week (millions of kgs)
D₁
Quantity of coffee per week (millions of kgs)
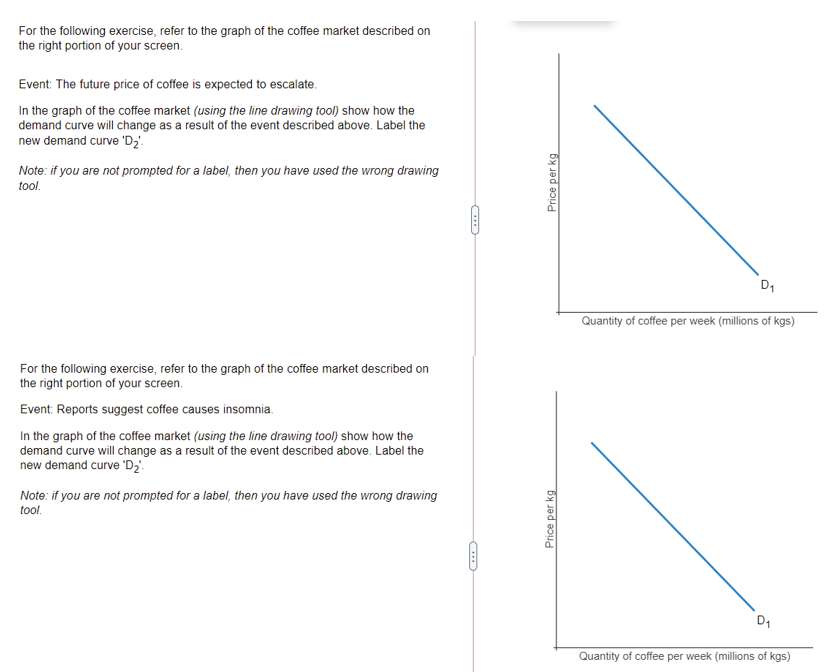
Transcribed Image Text:For the following exercise, refer to the graph of the coffee market described on
the right portion of your screen.
Event: The future price of coffee is expected to escalate.
In the graph of the coffee market (using the line drawing tool) show how the
demand curve will change as a result of the event described above. Label the
new demand curve 'D₂'.
Note: if you are not prompted for a label, then you have used the wrong drawing
tool.
For the following exercise, refer to the graph of the coffee market described on
the right portion of your screen.
Event: Reports suggest coffee causes insomnia.
In the graph of the coffee market (using the line drawing tool) show how the
demand curve will change as a result of the event described above. Label the
new demand curve 'D₂'-
Note: if you are not prompted for a label, then you have used the wrong drawing
tool.
←
Price per kg
Price per kg
Quantity of coffee per week (millions of kgs)
D₁
Quantity of coffee per week (millions of kgs)
Expert Solution
This question has been solved!
Explore an expertly crafted, step-by-step solution for a thorough understanding of key concepts.

Step by step
Solved in 5 steps with 4 images

Knowledge Booster


Learn more about
Need a deep-dive on the concept behind this application? Look no further. Learn more about this topic, economics and related others by exploring similar questions and additional content below.Recommended textbooks for you

Principles of Economics 2e
Economics
ISBN:
9781947172364
Author:
Steven A. Greenlaw; David Shapiro
Publisher:
OpenStax

Economics (MindTap Course List)
Economics
ISBN:
9781337617383
Author:
Roger A. Arnold
Publisher:
Cengage Learning
Principles of Economics 2e
Economics
ISBN:
9781947172364
Author:
Steven A. Greenlaw; David Shapiro
Publisher:
OpenStax
Economics (MindTap Course List)
Economics
ISBN:
9781337617383
Author:
Roger A. Arnold
Publisher:
Cengage Learning


Exploring Economics
Economics
ISBN:
9781544336329
Author:
Robert L. Sexton
Publisher:
SAGE Publications, Inc

Microeconomics: Private and Public Choice (MindTa…
Economics
ISBN:
9781305506893
Author:
James D. Gwartney, Richard L. Stroup, Russell S. Sobel, David A. Macpherson
Publisher:
Cengage Learning